
The first wave of digital transformation at utilities brought files, paper maps, and workforce operations to PCs, and then the cloud. Since then, ERP, GIS, EAM, and engineering, vegetation, and planning tools have each created immense value for utilities, and their respective workflows have become digitally mature, but largely independently.
The second wave is AI.
Enterprise AI creates value by reasoning across isolated systems to create aggregated, network-level insights that would take humans months to accomplish due to data bottlenecks, workplace politics, and competing priorities. Over 80% of organizations have explored or piloted GenAI, but only ~5% reach production and realize revenue value.1 CIOs now face pressure from Boards who want to know why.
To generate these insights, AI models require a shared, normalized engineering context that allows them to read comprehensive asset data and understand how that data connects and overlaps across departments. Without centralized asset context, AI can’t provide the workflow optimization and enterprise-level insights it promises. It may not come as a surprise that only 26% of organizations are confident their data can support AI-powered workflows.2 A network intelligence layer closes this gap. It gives AI the shared, normalized engineering context it needs, and it builds on the tools utilities already have.
A network intelligence layer is different from a data lake or ontology software, which store and organize data. It models a utility’s physical network, connecting dynamic engineering analysis and condition data with asset records, maintenance tools, and capital planning into a single application. Teams can then simulate and test against this centralized model, while AI can act upon it to generate network insights.
How we got here: point tool proliferation
Point solutions have multiplied across the tool landscape as teams bought software to solve discrete operational problems, often without central IT visibility. These specialized tools have deep domain expertise and utility, but narrow applicability. To increase the value of each investment, the default solution has been to add integrations from new point solutions to existing point solutions, and to legacy data lakes, GIS, and EAM platforms.
The result is that basic business processes are now scaffolded together with hundreds of point-to-point integrations. No single system holds a complete, normalized view of the network across disparate data sources, such as LiDAR, GIS, inspection data, imagery, outage history, or work orders. Rather than a big-picture view, teams end up with a fractured picture through different lenses for different tasks, without any view of how they actually intersect in the field. When data isn’t traceable to the asset level, analysis can’t scale, and results are hard to defend because the inputs are hard to verify.
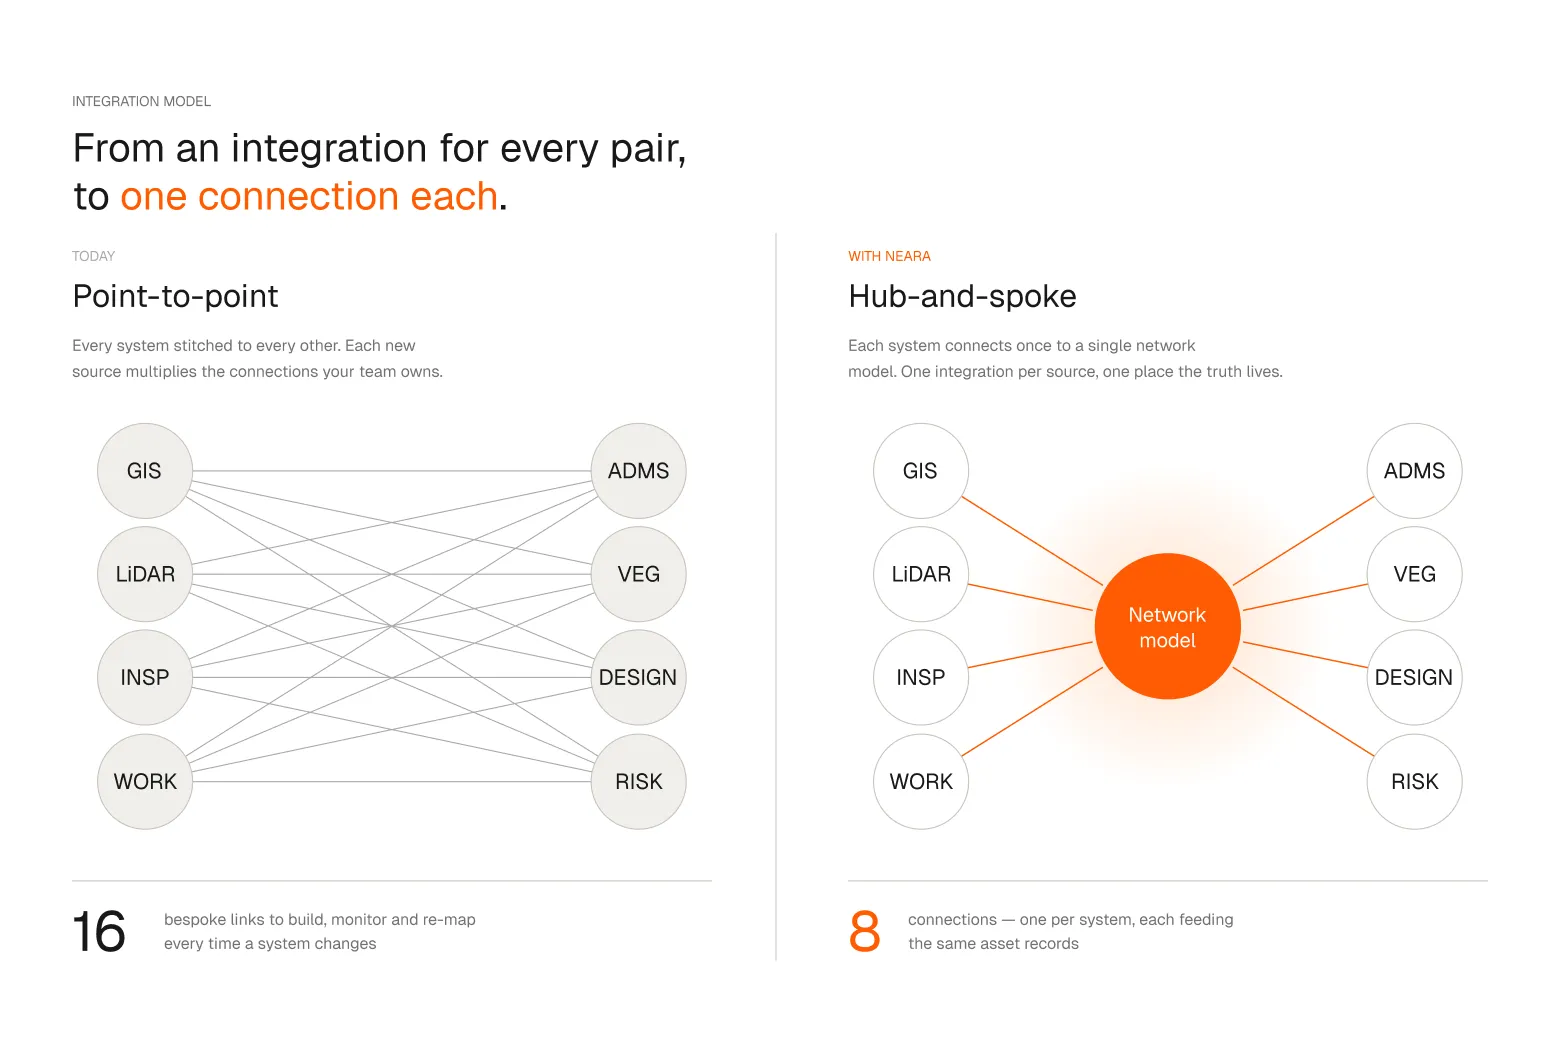
If, for example, your network is in a wildfire-prone area, but you’re also facing load growth, the consequence of this fragmentation is that you can’t design a new network with an idea of how it impacts your wildfire risk exposure, and vice versa.
And because each integration point transforms data, data fidelity degrades across hundreds of integrations. This makes answering the high-level business questions needed to build efficient and defensible capital plans with AI disproportionately time-consuming and expensive because the AI models are only as accurate as the network data feeding them.
This includes some of today’s most existential questions, such as:
- “How do I route a new network build to minimize vegetation program costs?”
- “How can I balance spending across competing risk-reduction initiatives for wildfire, safety, reliability, and environmental risk within a fixed budget?”
- “Where can we use covered conductors without creating new capacity bottlenecks?”
Compliance challenges
Moving fast on AI without a trusted data foundation and intentional access controls creates compounding compliance exposure risk. If an AI system pulls from ungoverned or loosely tracked data sources, every output built on top of that data inherits the same uncertainty. Without a clear view of which data sources are feeding AI-generated responses, it sprawls into a web of decisions that all trace back to unverifiable inputs, rendering it nearly impossible to answer audit questions.
Consider a wildfire mitigation plan filing or a rate case data request. When a regulator asks how a risk score was calculated or why one feeder was prioritized over another, the answer has to trace from the decision back to the source data. If any step in that chain runs through AI tooling fed by ungoverned inputs, the utility cannot justify that answer, no matter how sound the underlying work was.
What to do about it
Utilities need to simplify their enterprise architecture and technical complexity while preserving existing investments. CIOs must close the gap between AI ambition and data readiness as boards and regulators increasingly ask for proven ROI on AI investments. Doing nothing results in compounding integrations and maintenance, making the gap even more expensive to close.
To create a tool landscape that you can govern, explain, and defend to a board or a regulator, you need a single, trusted view of the network that engineering, operations, planning, and the AI program all draw from, maintained in one place rather than reconciled across disparate tools.
To create a single view, a network intelligence layer ingests data from the systems already in place, including GIS, LiDAR, EAM, and inspection records, and normalizes each input to create a complete record of the specific asset it describes. The model simulates how assets behave under real conditions, so teams can measure clearances, test interventions, and evaluate designs against weather and load scenarios before committing capital. And because every output traces back to a verifiable input at the asset level, the insights AI generates from it hold up in front of a board or a regulator.
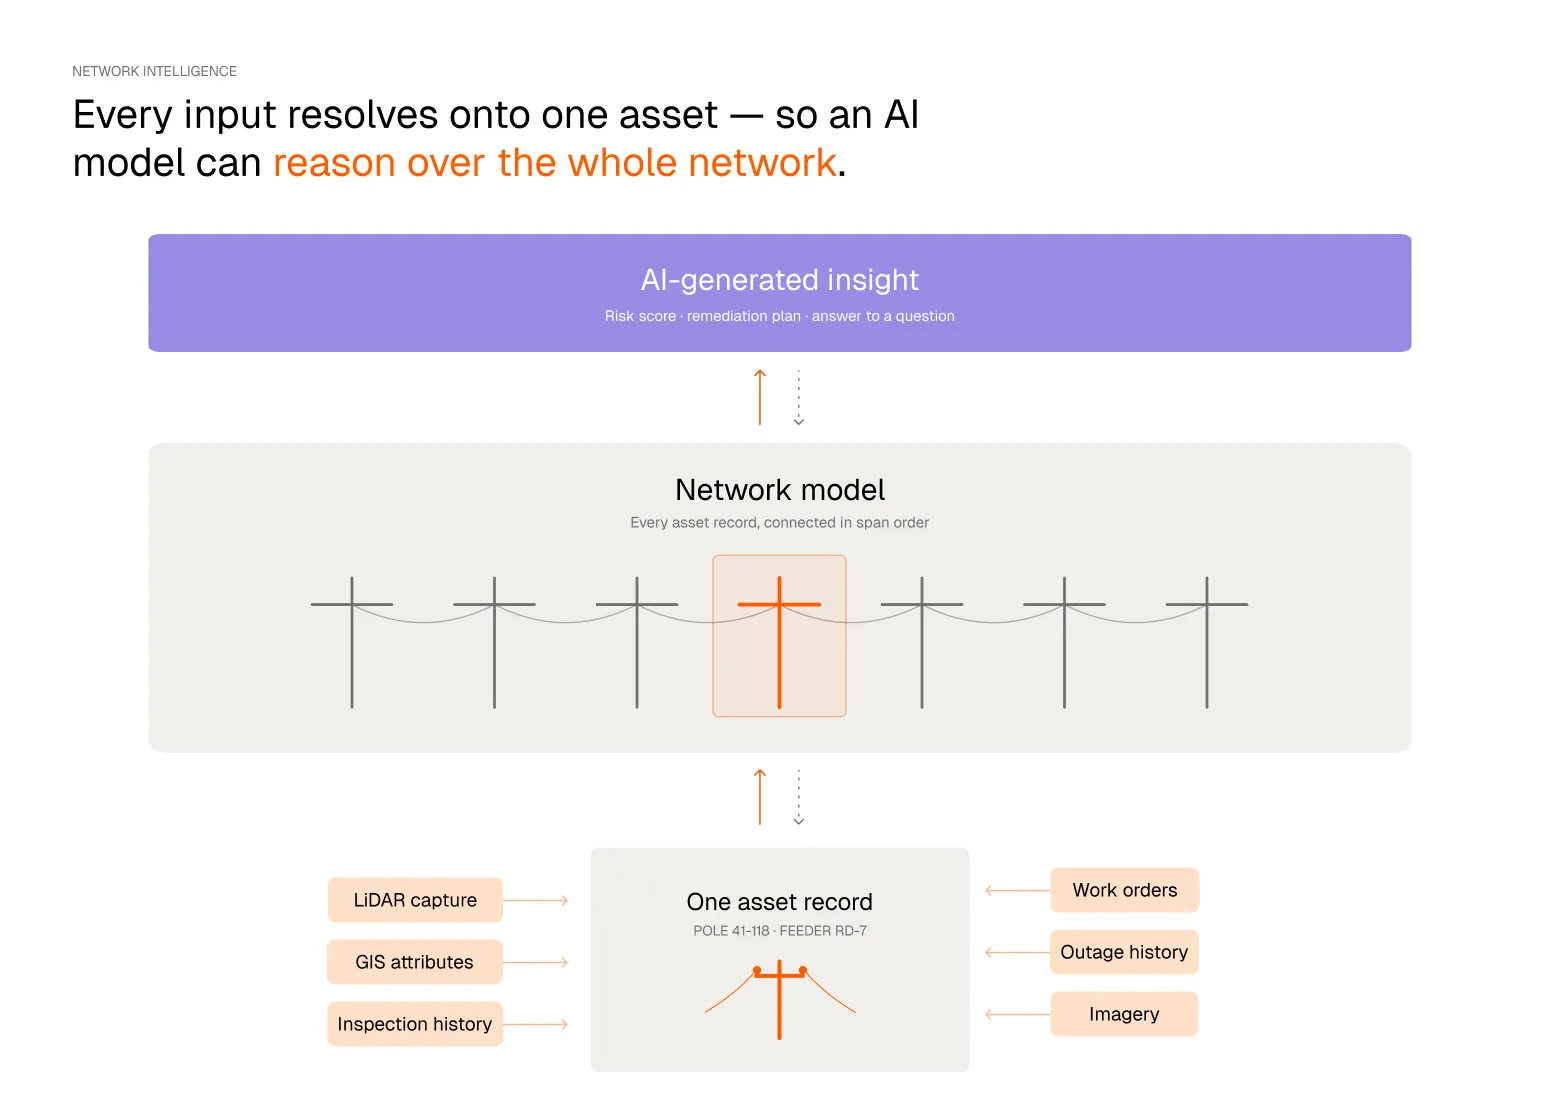
An objection to this approach might be that this sounds like one more platform in an already crowded stack. There are two key aspects that separate it from another point solution. First, it normalizes data to the asset rather than transforming it at every integration, so data fidelity improves as sources connect instead of degrading. Second, it can replace several tools rather than adding to them, so the tech stack and its maintenance cost go down as functionality moves to the model.
We’ve seen utilities approach a network intelligence layer in two different ways. These examples are illustrative rather than mutually exclusive, and the right approach depends on your goals and operational constraints.
Path 1: Build around what you have
One CIO decided to build his network intelligence layer around the systems his team already runs. Rather than replacing tools, he is connecting them through a single model that enhances each point solution. He came to this decision with a sunk investment to protect. His team had committed significant budget to an enterprise ontology platform and built organizational buy-in around it. Removing it would have meant writing off that investment and telling teams who had already rebuilt their workflows around the platform to start over. As a result, he is deploying the network intelligence layer as an integration hub that connects and enhances the ontology platform, alongside their wildfire risk assessment tool and existing cloud infrastructure.
The goal is for data that previously lived in separate tools to answer combined questions. With a network intelligence layer, they will be able to answer questions like:
“Based on tree health and historical outages on Feeder A, where should I deploy crews over the next 6 months to maximize SAIDI improvement?”
The tradeoffs of this path include:
- Preserve the value of committed investments and require far less change management, since teams keep the tools they know.
- Higher ongoing spend on integration maintenance, though far less than managing hundreds of point-to-point connections.
Path 2: Replace what you don’t need
A second CIO made the opposite call and decided to consolidate the utility’s tech stack. He saw the value of a network intelligence layer but needed to cut spending elsewhere to justify the investment. His team mapped exactly which tools the platform could replace: 15 disconnected Excel-based risk models, a LiDAR processing and viewing tool, an overhead design tool, a satellite-based vegetation management platform, and their workforce operations and field mobility systems.
The savings will come from AI-enabled LiDAR processing, employee productivity, reduced vegetation spend, and eliminated software licenses. The larger win is that the team is moving pole replacement design, work execution, inspections, and field reconciliation into a single system. Field data will flow back into the model automatically, improving GIS accuracy and recalculating risk without any additional data reconciliation. This allows them to better design pole replacements and continue the continuous improvement cycle automatically.
The tradeoffs of this approach include:
- Significantly lower tech and integration maintenance costs, plus a compounding data quality loop.
- Heavy upfront investment in change management. Training teams on a new platform is a core component of the deployment.
The outcome
A network intelligence layer gives a CIO an architecture simple enough to govern, with fewer tools, fewer integrations, and a single view of the network that engineering, operations, planning, and the AI program all draw from. It also supports an AI investment that finally pencils, because it creates outputs that trace back to verifiable, asset-level inputs that in turn hold up in front of a board or a regulator. This foundation is the baseline required to support the second wave.


