Solutions

Asset Management

Replace the structures that need replacing, defer the ones that don't, and show the load calculation behind every call.
Judge every asset on what it can carry, not how old it is

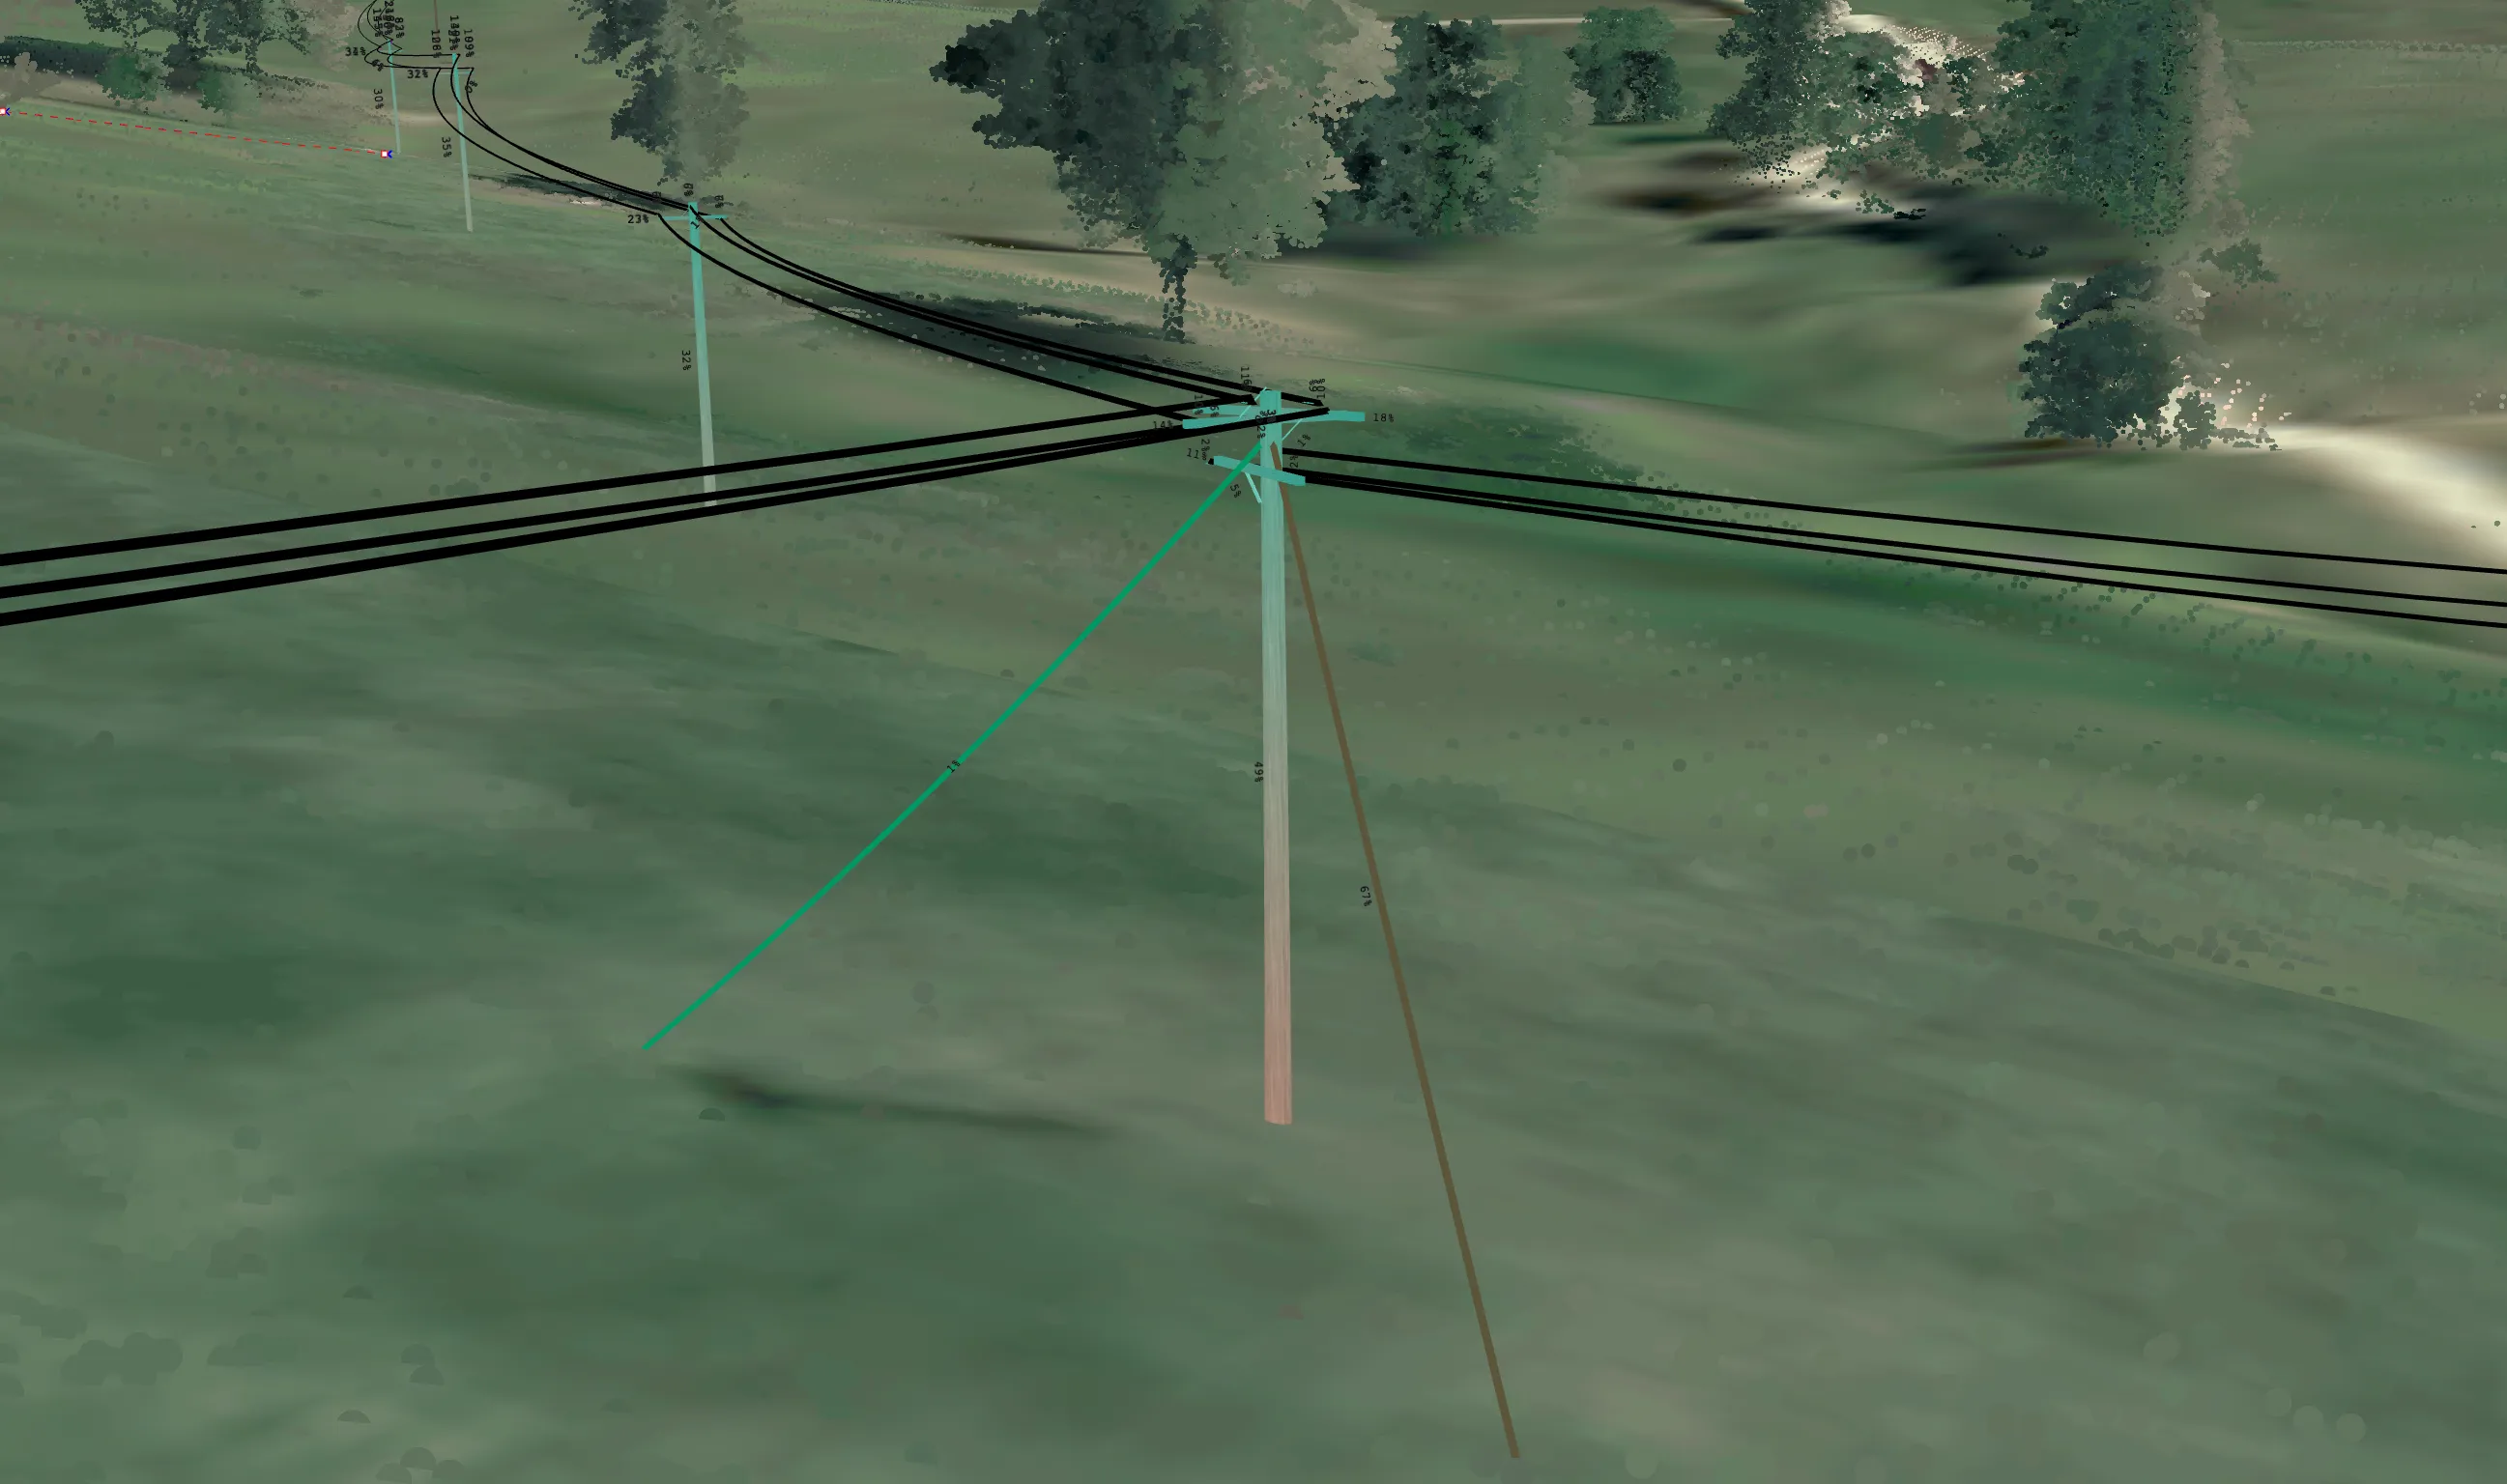
Install dates and inspection grades describe the past. Model each structure against its real geometry, attachments, and local weather to see which ones still hold, and which are already past their rated load.

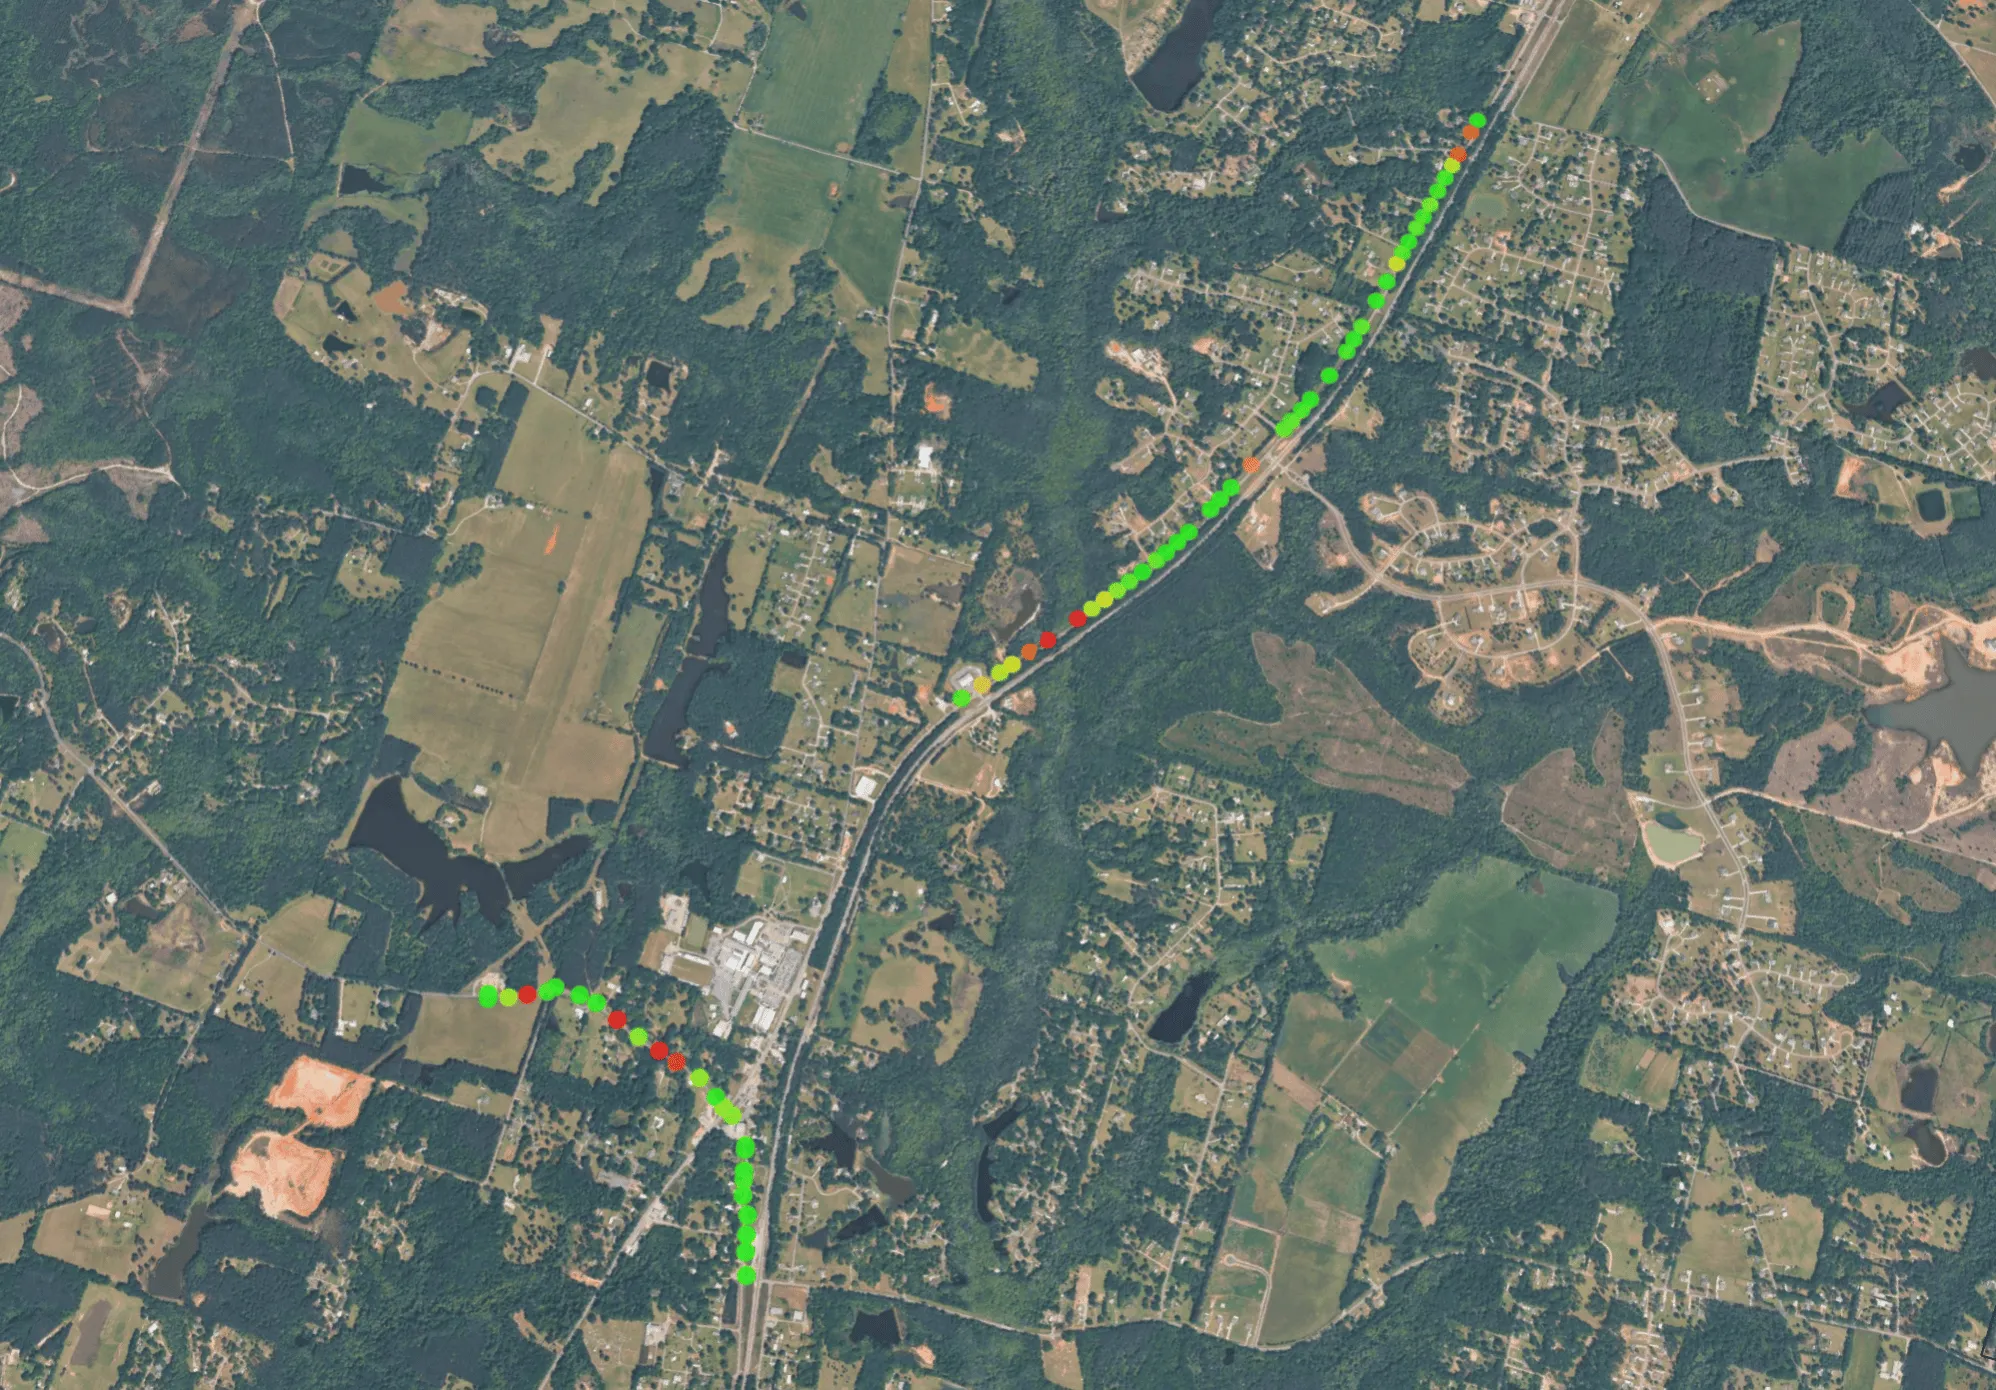
Rank replacement candidates by measured load so the 2011 pole carrying an unrated fifth attachment outranks the 1969 pole standing in firm ground.

Prove the structures you're deferring still hold with a load case per pole and the conditions it fails under, not a sampled field grade and a signature.

Find the poles your GIS never recorded by reconciling LiDAR against your records, so you stop maintaining a network you only partly know.

The problem

Age tells you when an asset is due, not whether it will hold

Install date, last inspection grade, and failure history all describe the past. None of them answers whether a structure carries its current load through a 90 mph gust. So condition indices get built, weighted, and defended, while the question underneath stays open:

  • A 1969 pole in firm ground carrying two attachments, condemned on age alone
  • A 2011 pole carrying a fifth attachment it was never rated for, passed on age alone
  • A pole missing from GIS, inspected by nobody, on a cycle no one owns

You end up replacing sound structures on schedule while the ones that actually fail stay in service.

Then the regulator asks why this volume, at this cost, and the answer is a methodology rather than a calculation.

From replacing on schedule to replacing on evidence

From To
Age-based replacement cycles Capacity-based replacement decisions
Sampling a percentage of poles each year Assessing every structure every cycle
Qualitative field notes Auditable load calculations
A record of what should be out there A model of what is out there

Make asset calls you can put in front of a regulator

When every pole, crossarm, and attachment sits in one structural model, you can defend what you replace, what you defer, and what you leave alone.
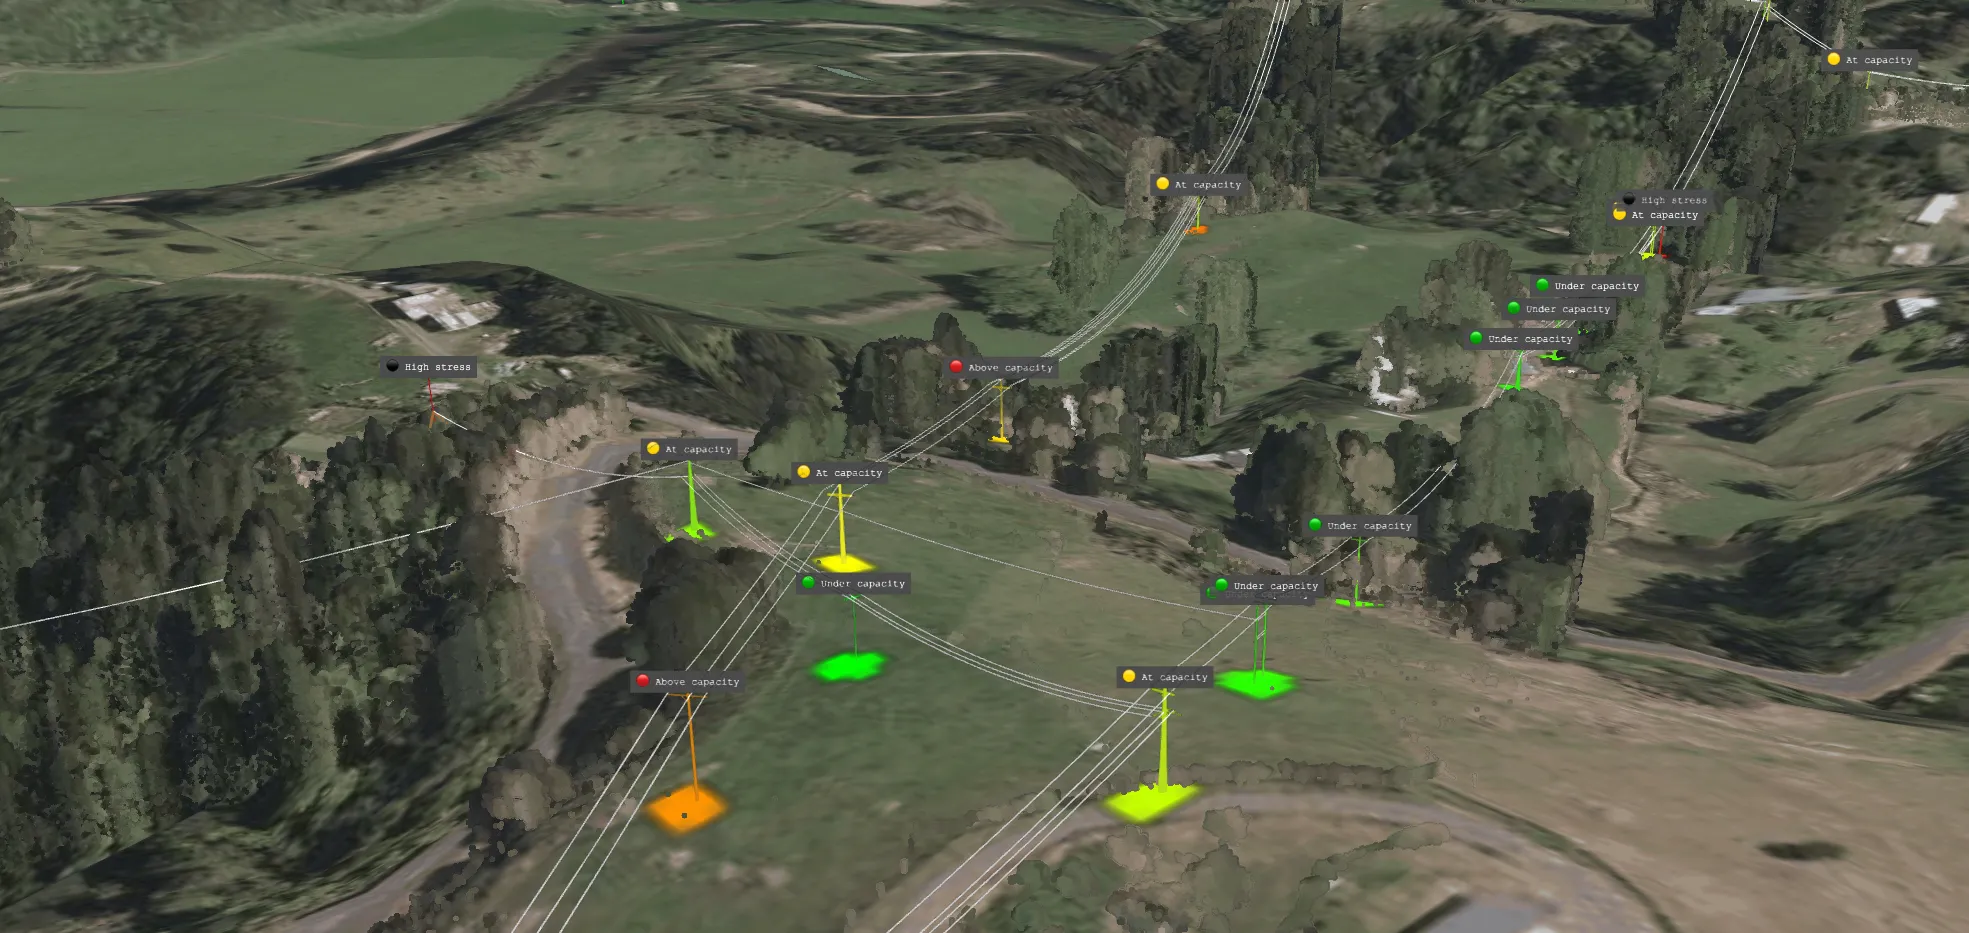
Defer replacements without carrying the risk by showing which condemned structures still hold their rated load, and the conditions under which they stop.

Send crews where the model points, not where the cycle points cutting truck rolls to poles that were always fine and catching the ones no inspection route covers.
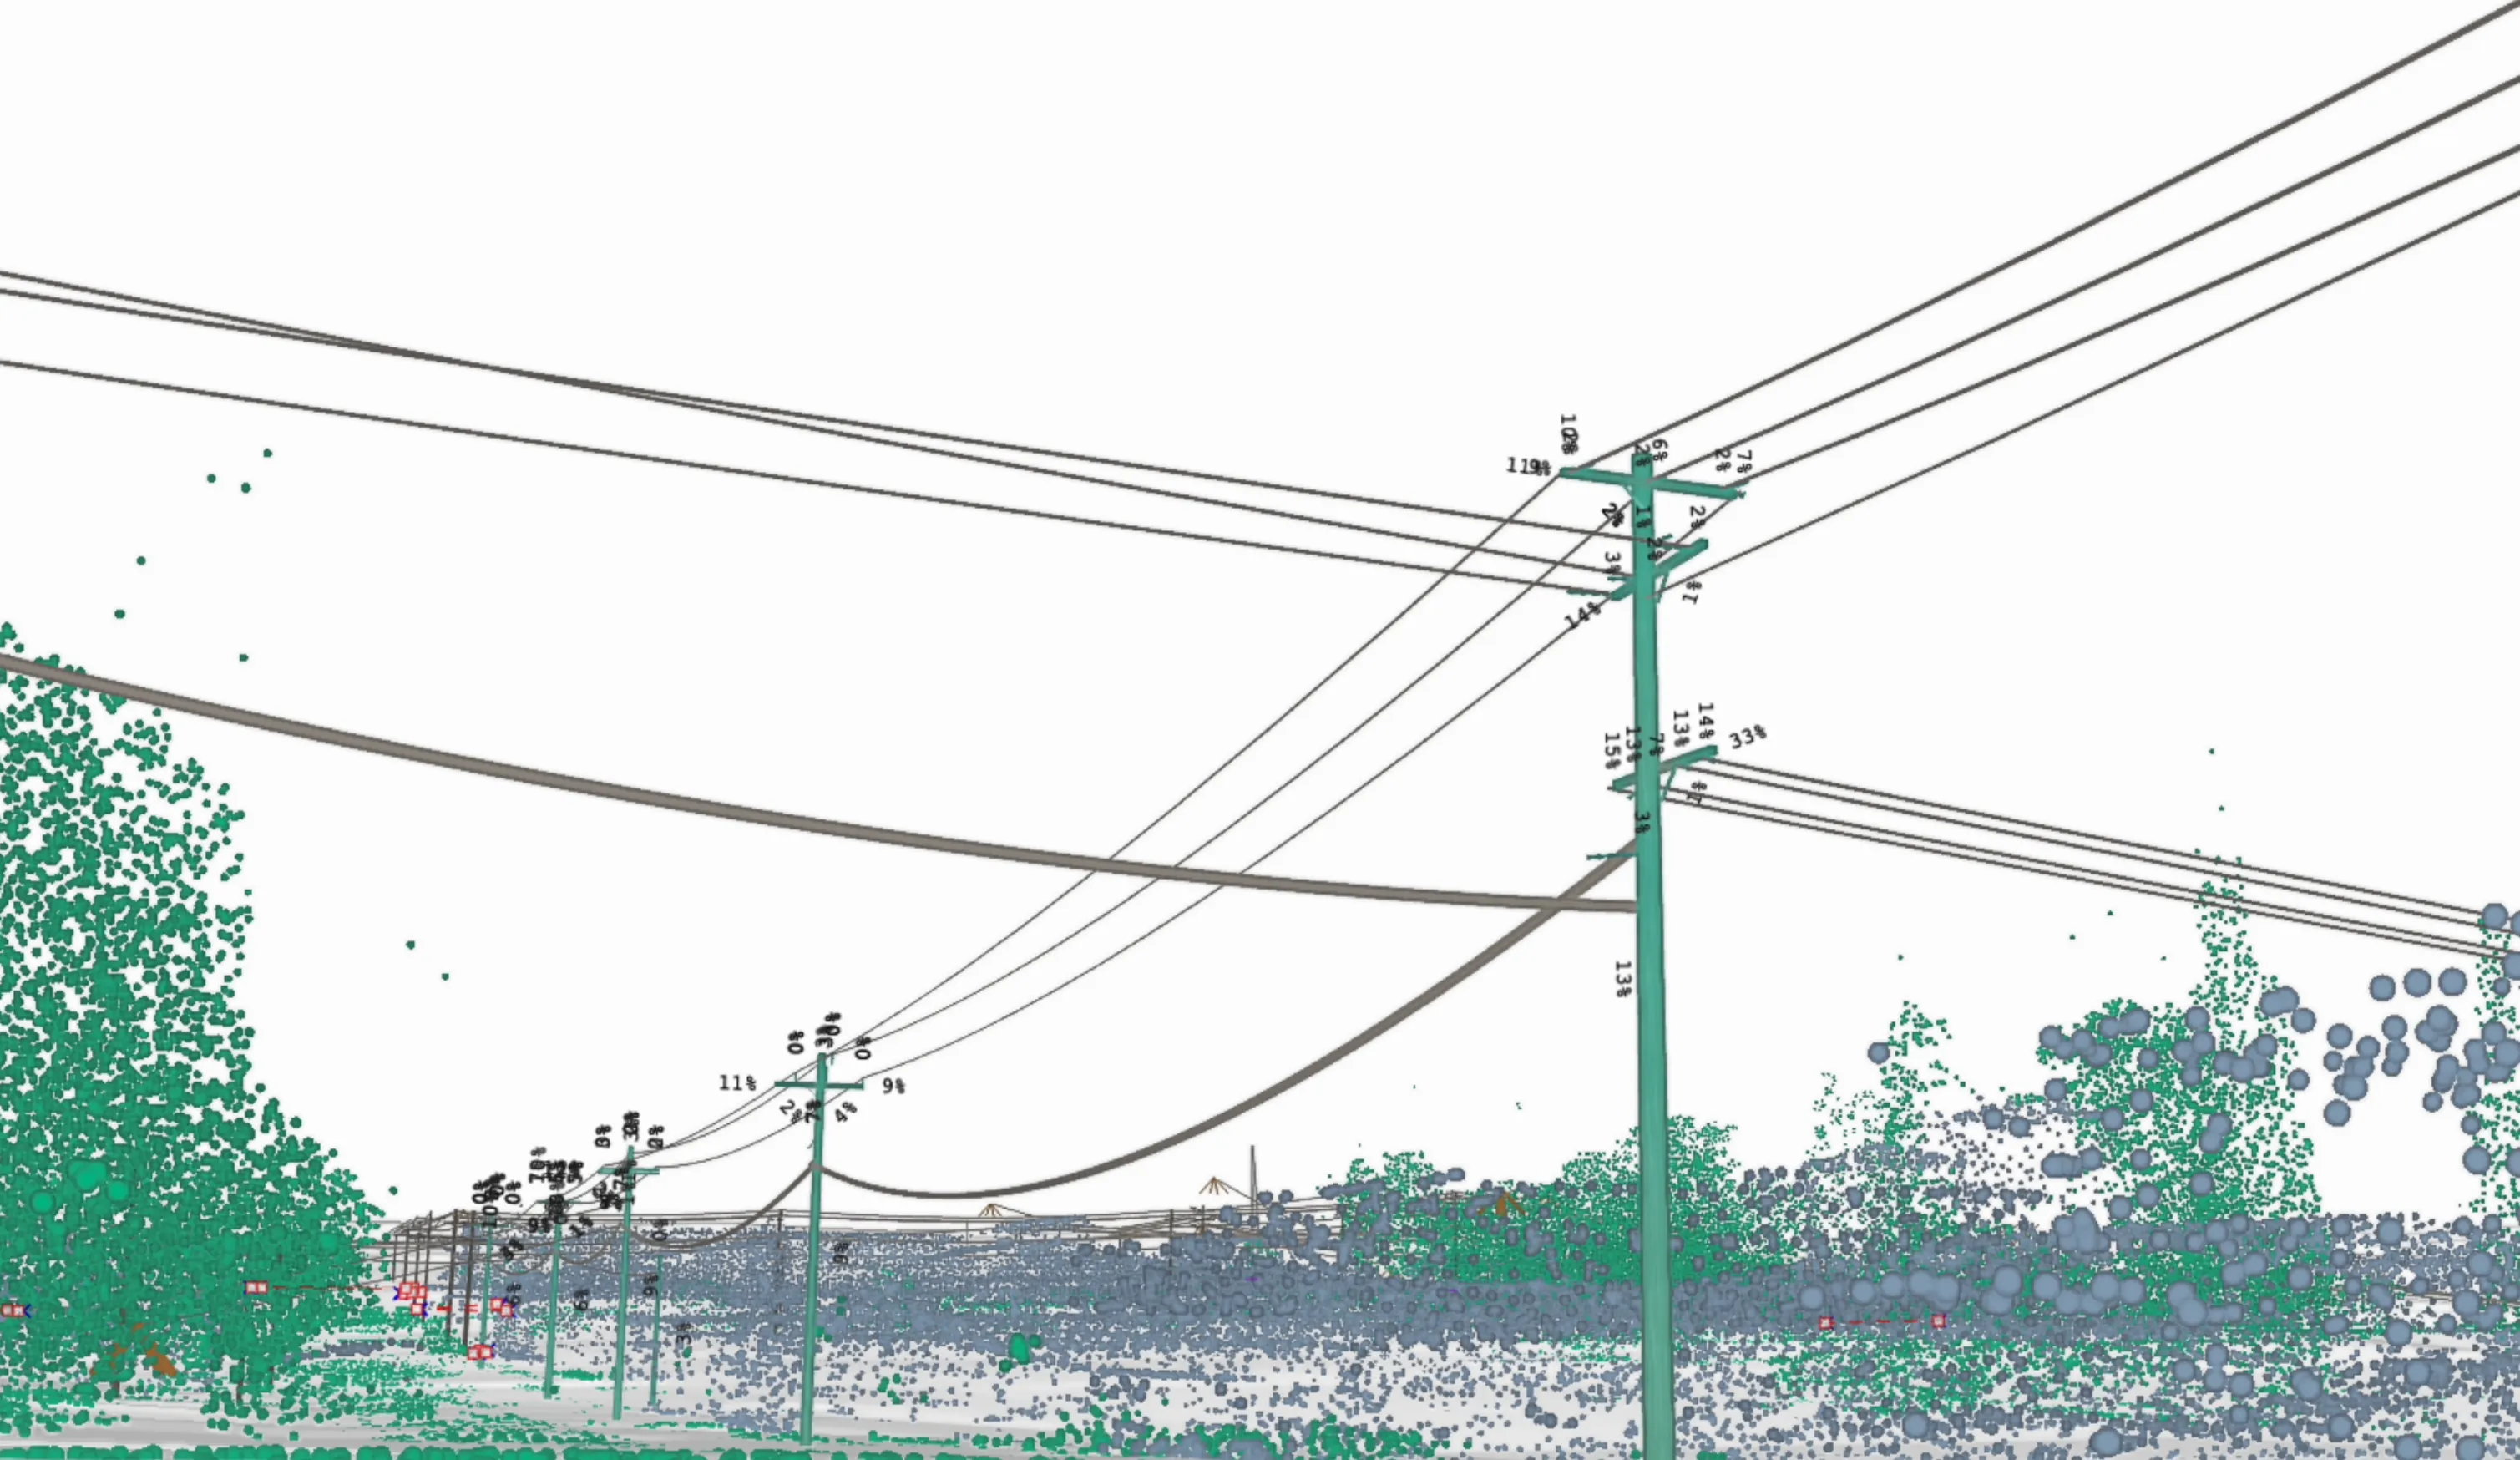
Know how much load every pole can still take before you approve the next attachment, reconductor, or capacity increase on that span.
Hand over the calculation, not the conclusion with load cases, weather assumptions, and measured geometry traceable behind every structure in the filing.

Real-world applications

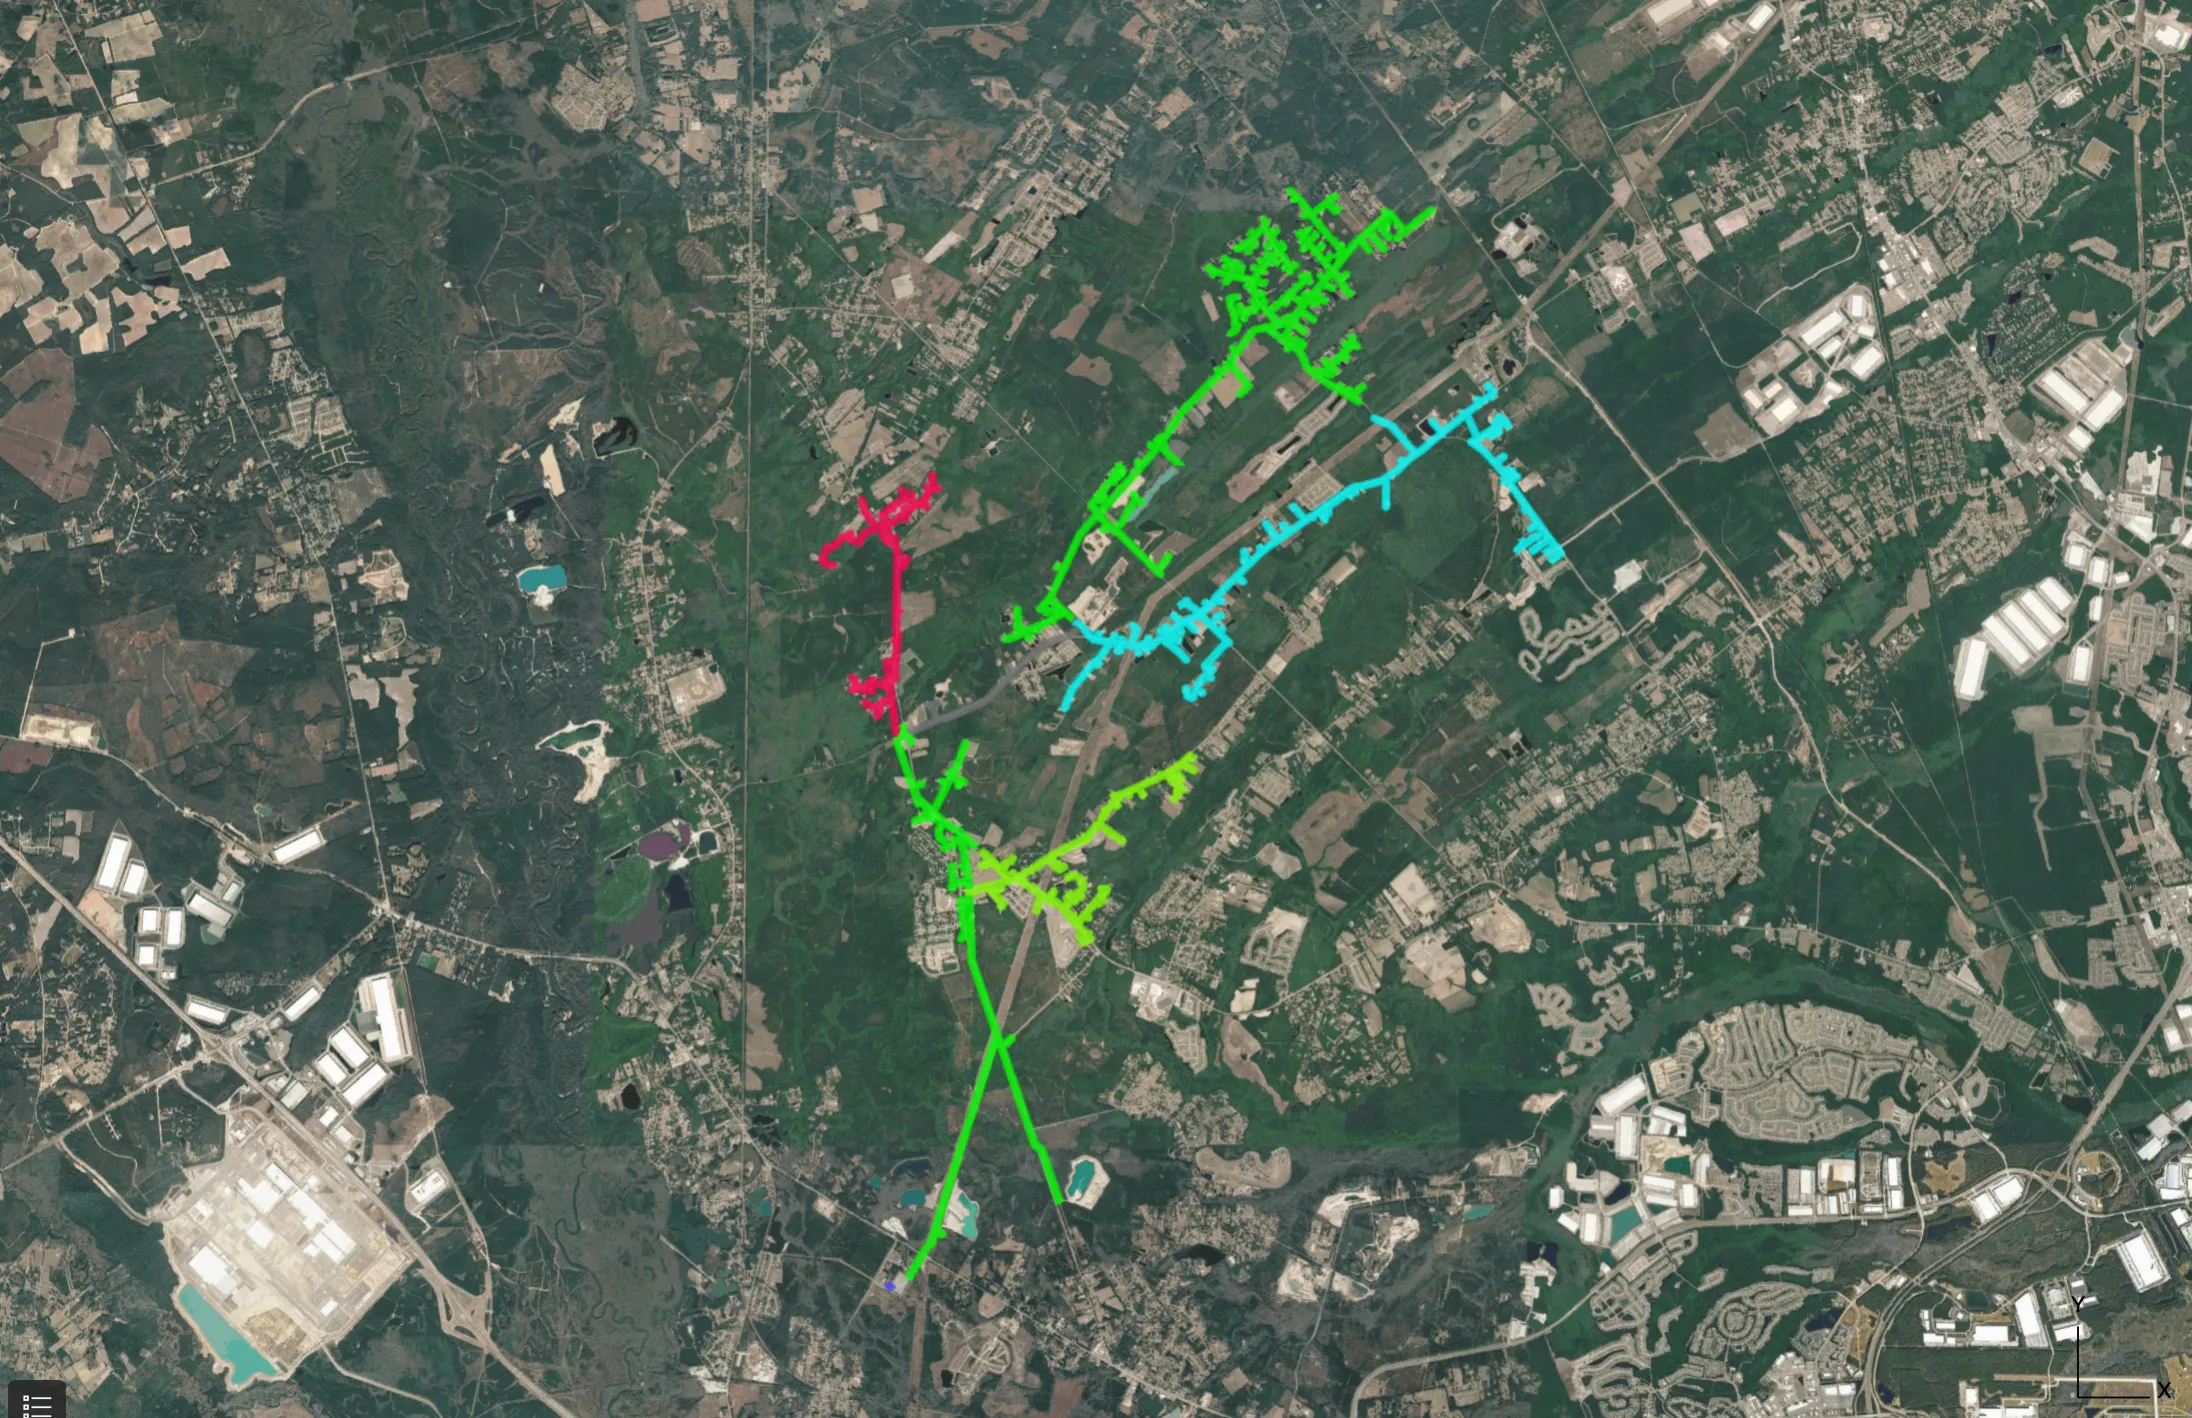
Cutting $5M a year from asset inspection spend

Cutting $5M a year from asset inspection spend
Australia
~$5M off annual
inspection spend
Cyclical field inspections
Model-targeted inspections

The Challenge

Crews inspected on a fixed cycle, visiting structures whose condition was already understood while others went unseen for years. The spend was steady, and the risk picture barely moved.

The Analysis

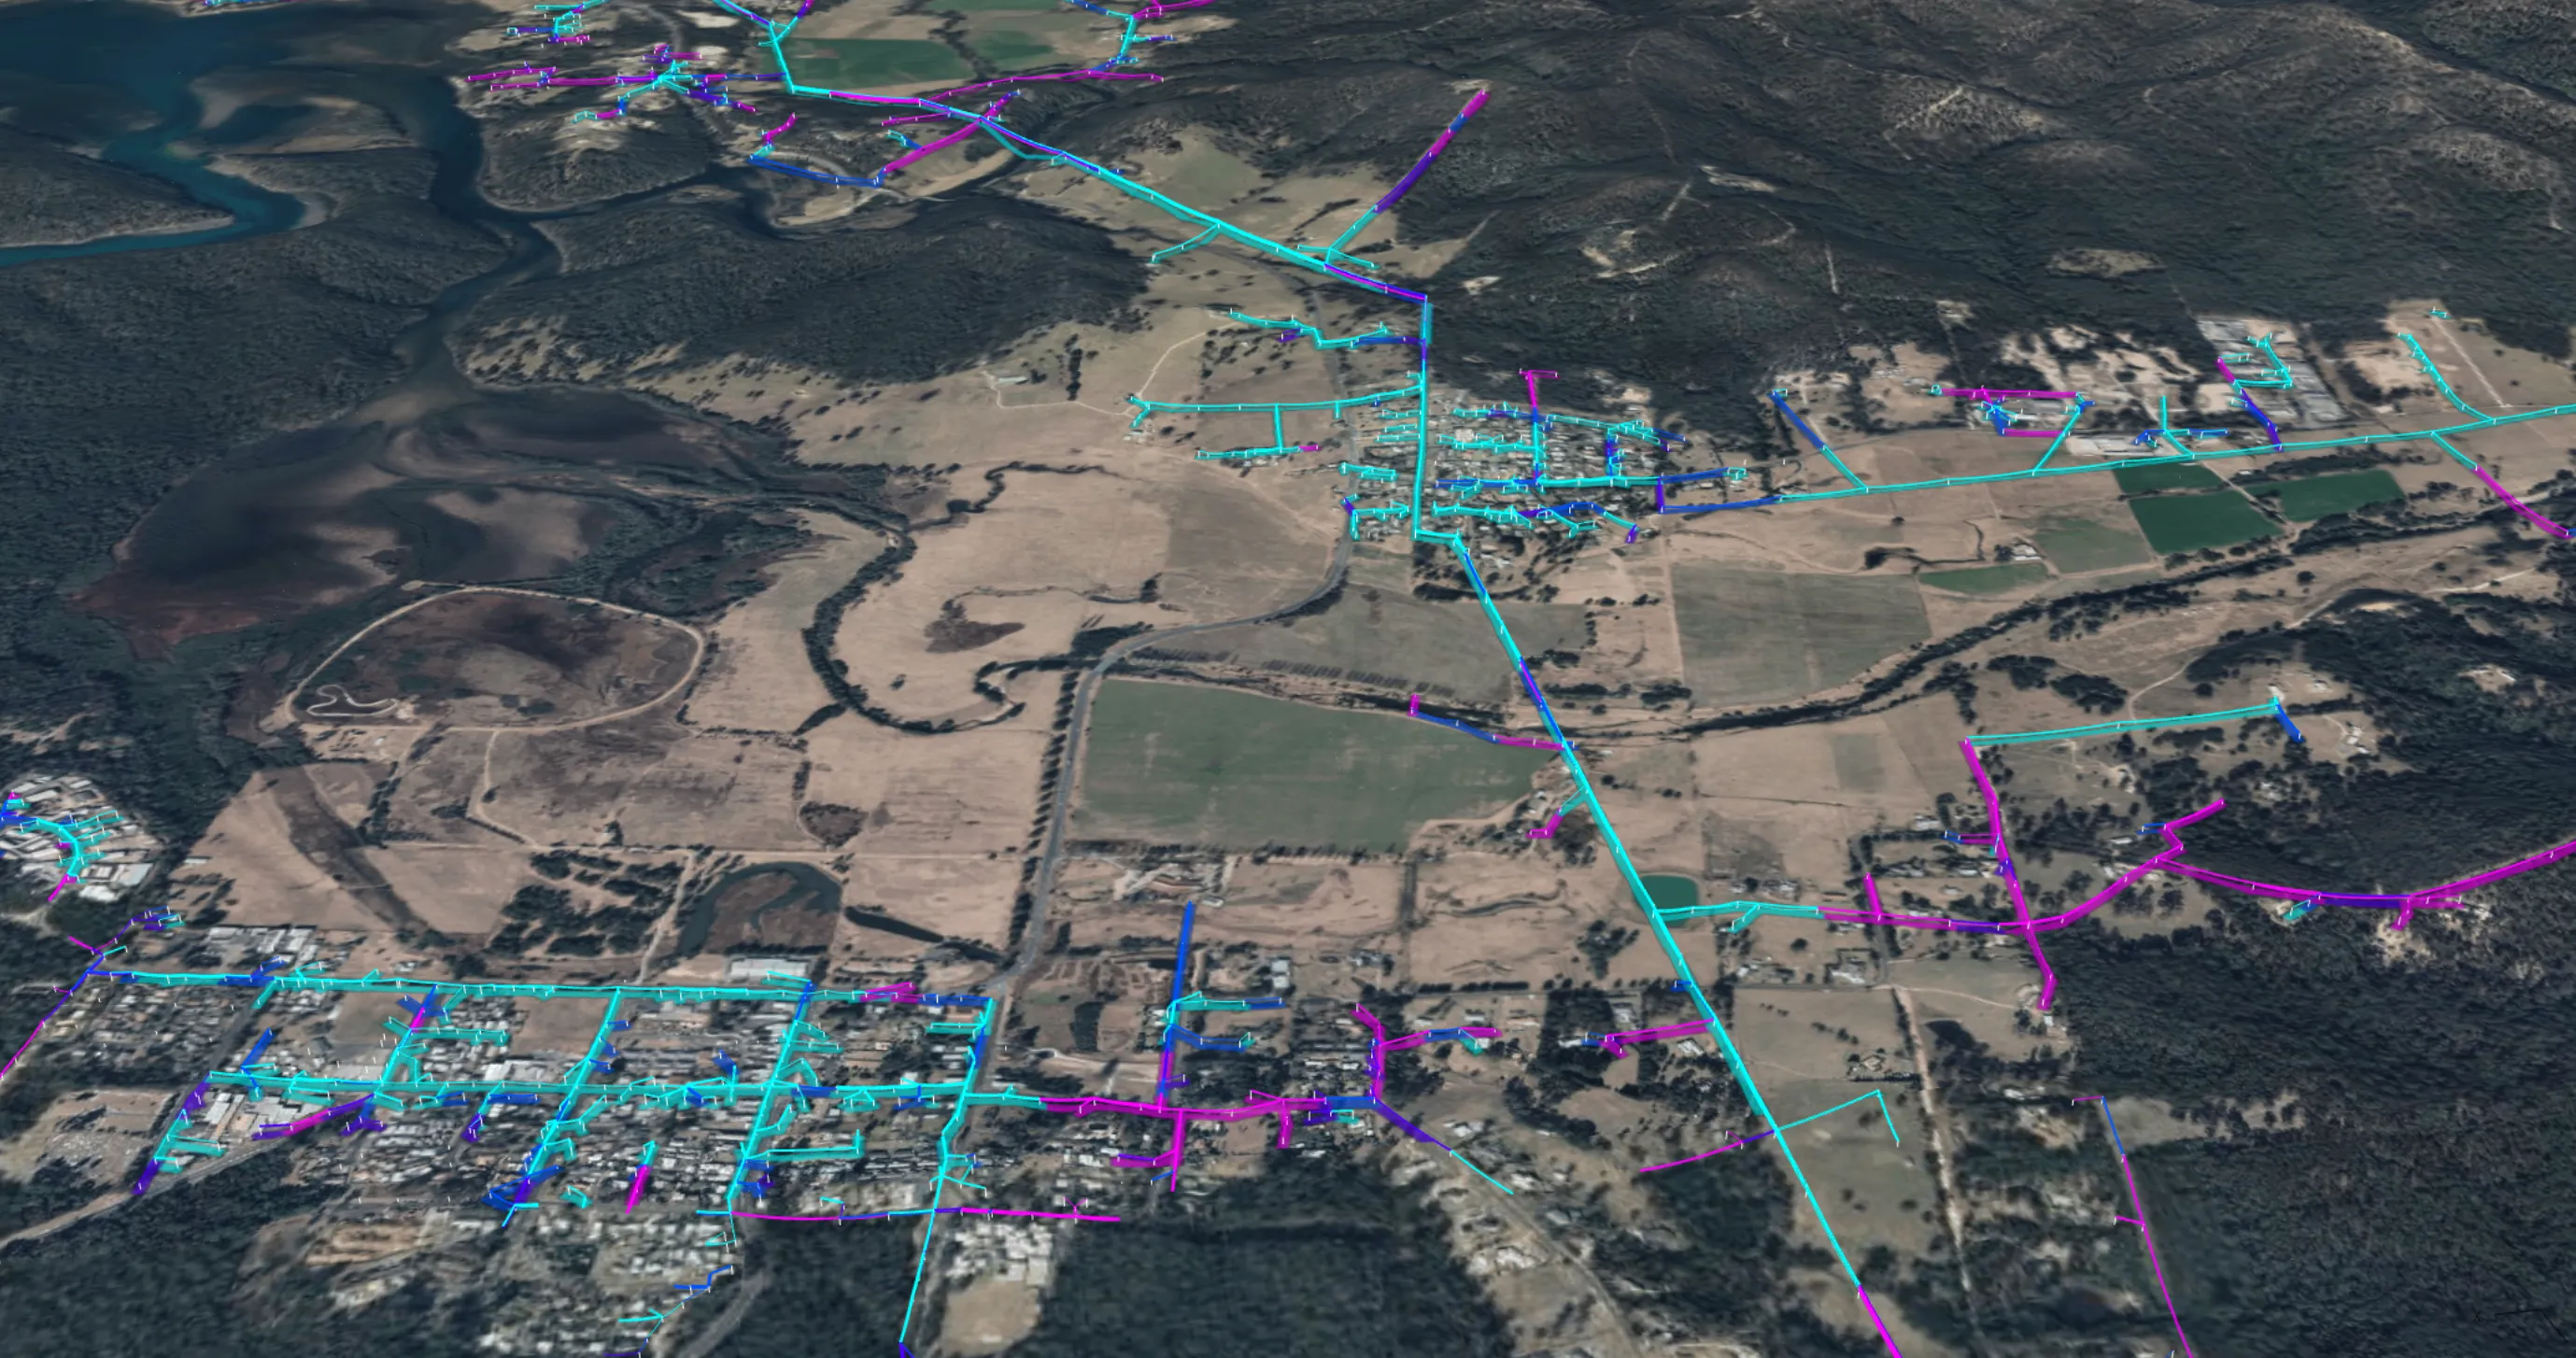
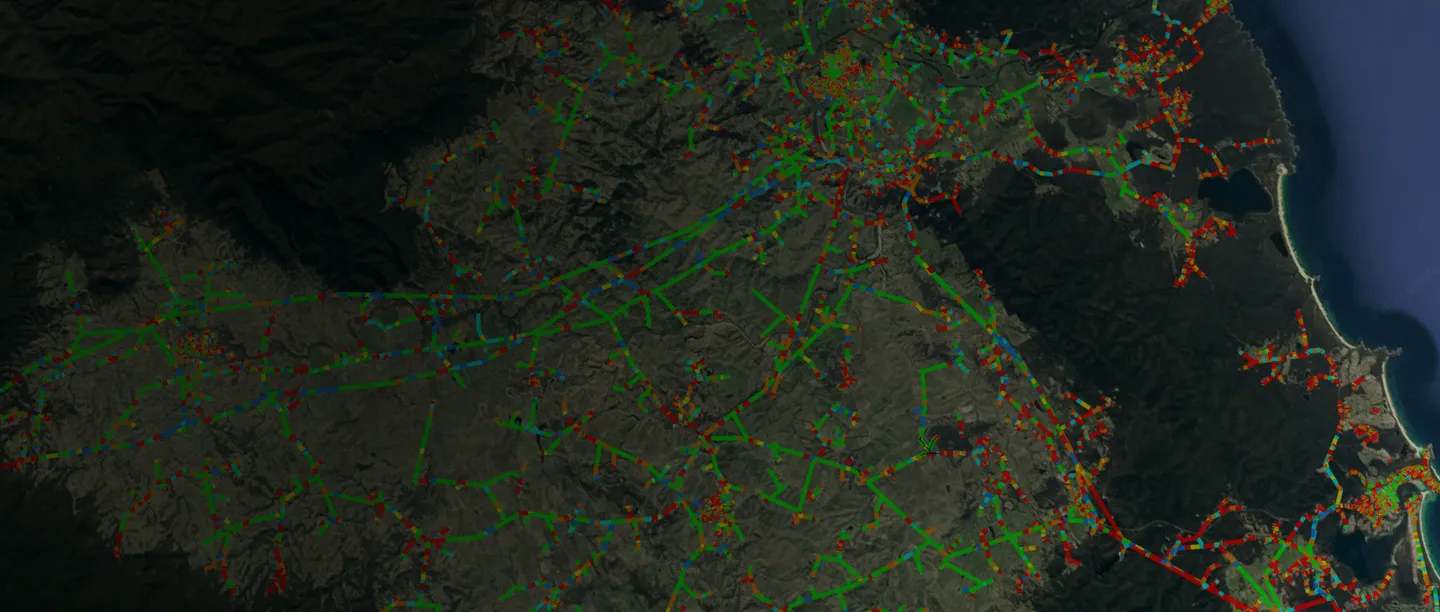
Remote, model-based assessment across the network established which assets warranted a field visit and which could be cleared without one, with the reasoning attached to each structure.

The Outcome

Around $5 million off annual asset inspection spend, with asset risks surfacing 10x faster than the previous field-led approach.
From describing asset condition to calculating it

From To
Statistical failure models Physics-based structural analysis
Condition indices and inspection grades Simulated performance under real load
Inspection, LiDAR, and GIS in separate systems One record every team works from
Defending spend with precedent Defending spend with load cases

Explore all workflows

Asset Management

Equipment Inspections

Stress-test and diagnose every single asset across the full lifecycle from repair, replacement, and reconfiguration without setting foot in the field and focus field time on validation and triage. Digitally inspect your equipment so you can see how every asset will respond to simulated gale force winds, flash floods, and more when you can't have your team out for the real thing.

View full page
  • Prevent more outages and safety incidents by keeping your equipment in its best shape.
  • Stop manually answering the same hundreds of questions per pole. Leave the manual heavy lifting to AI and empower your team to focus on the right questions about improving resilience.
  • Be the first to know about critical vulnerabilities by simulating hundreds of mechanical and environmental variables, from heat waves to line tensioning, so you can see the unforeseen and take preventive action.

Replace, repair, or reconfigure?

Look to your network model for a 90% automated triage plan to get every asset in shape.

  • See which equipment needs attention and diagnose the right next step for each asset.
  • Choose whether to replace a concrete pole with steel, add a stay, or relocate.
  • Measure pole height, lean, bend, and conductor tension with precision at scale.
  • Stress-test your equipment to find and fix your weakest links.

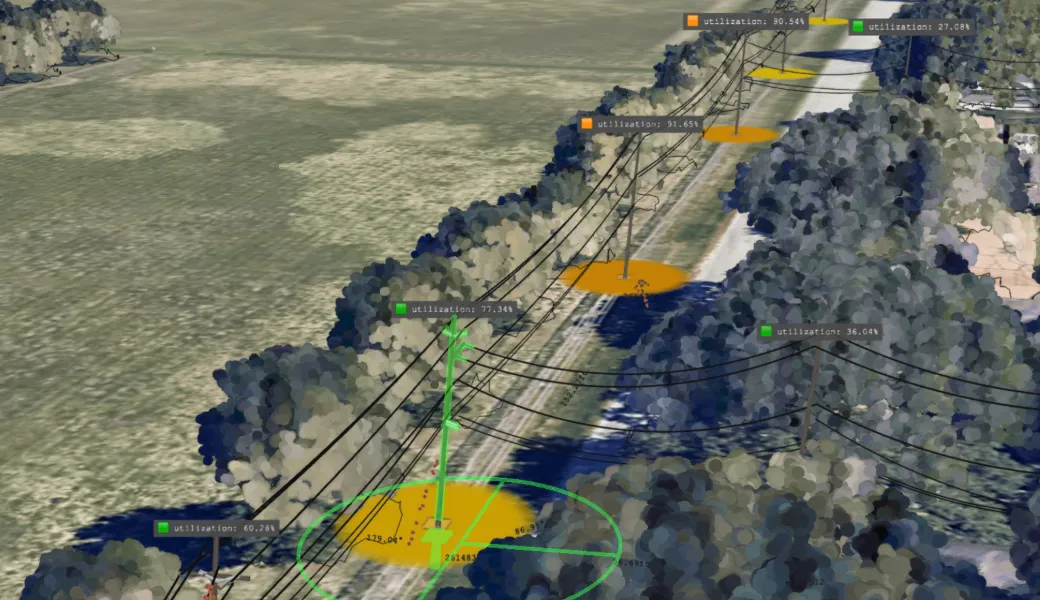
Get pole load "just-right"

Find the ideal pole load so your efficiency never becomes the enemy of reliability or safety.

  • Maximize pole utilization for broadband joint use and expanding carrying capacity.
  • Avoid the catastrophic consequences of pushing pole utilization too far.
  • Stress-test every pole against hundreds of mechanical and environmental variables.
  • Find the right loading formula that supports productivity without risking failure.

Flag buddy poles

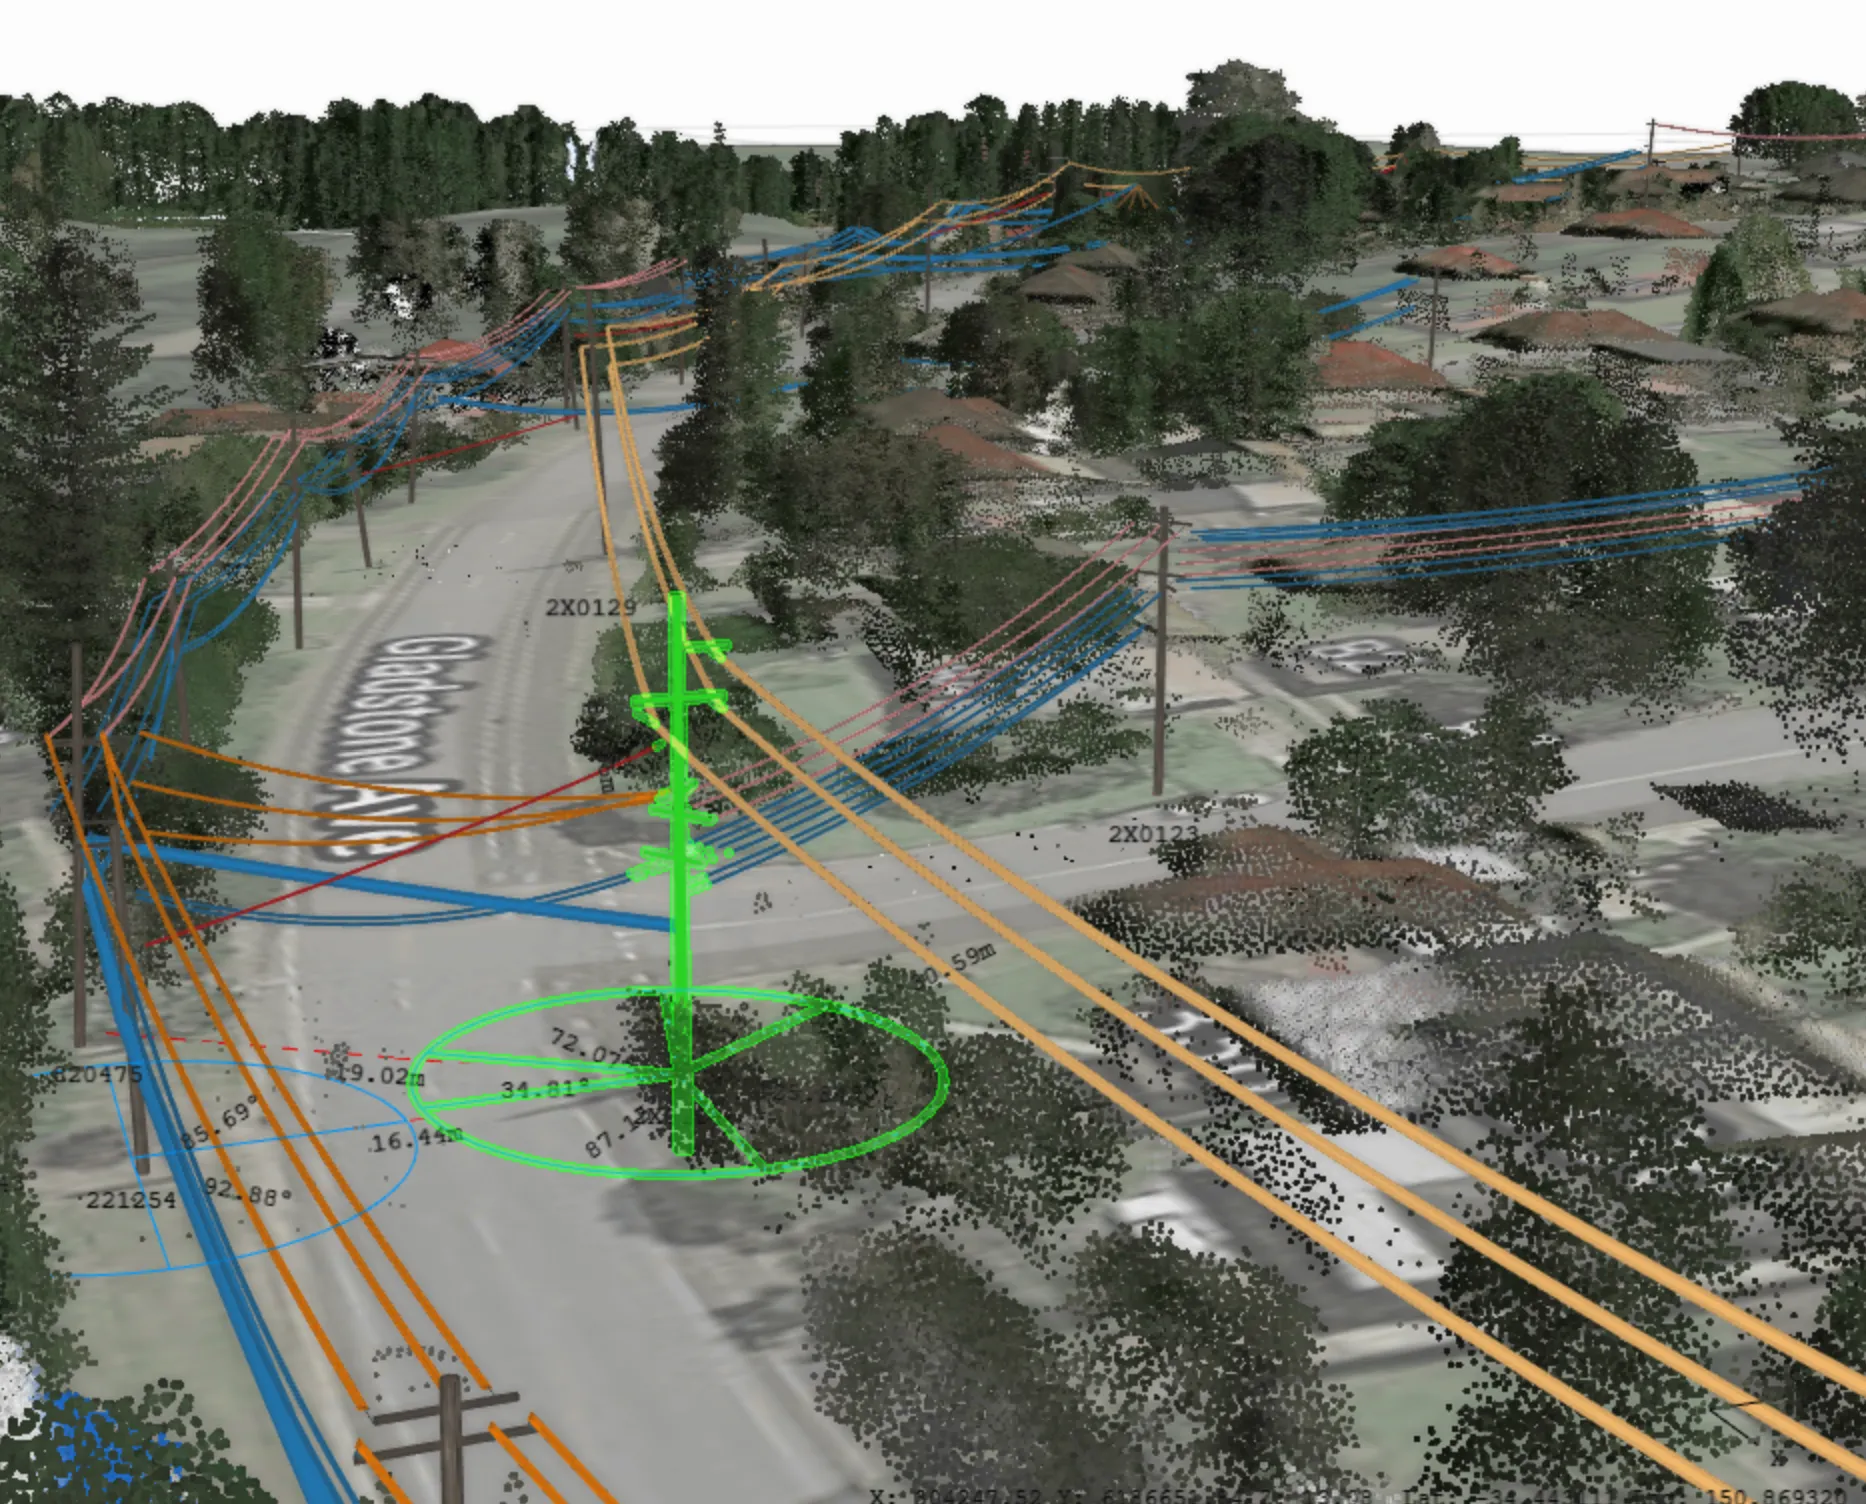
Automatically detect and flag double poles so you can maintain every asset, not just the ones in your GIS.

  • Find poles you cannot maintain today because you are unaware of them.
  • Detect double poles by height, type, and spatial relationships in your network model.
  • Get a clear lay of the land across every asset you are liable for.
  • Allocate maintenance work orders with confidence across all assets that need attention.

Safeguard against conductor clashing

See exactly where clashing and galloping are most likely and most severe, without relying on field surveys.

  • Track conductor behavior that changes on a dime in different conditions.
  • Pinpoint tension imbalances and structural flaws across every conductor in your network.
  • Layer on prime wildfire conditions or a hailstorm to test each span.
  • Act against short-circuiting and equipment failure before they happen.

Understand cumulative asset stress

Factor in how asset integrity changes over time as equipment experiences cumulative stress like cable creep.

  • Go beyond how assets stand today or fare in high winds, ice, or heat.
  • Simulate creep curves in custom increments based on the actual age of assets.
  • Layer in as many other variables as you see fit for thorough inspections.
  • Make the best lifecycle decisions with a view of stress over time.

Stay ahead of asset failure with network-wide FEA

Calculate strain and stress on all network components with AI-assisted FEA in your digital model.

  • Cover poles, spans, cross-arms, insulators, pins, and braces.
  • Detect hidden risks and prioritize replacements and repairs.
  • Evaluate which poles are at capacity and which can carry more load.
  • Keep every asset at peak performance, no matter where you are in the lifecycle.
Asset Management

LiDAR & GIS Reconciliation

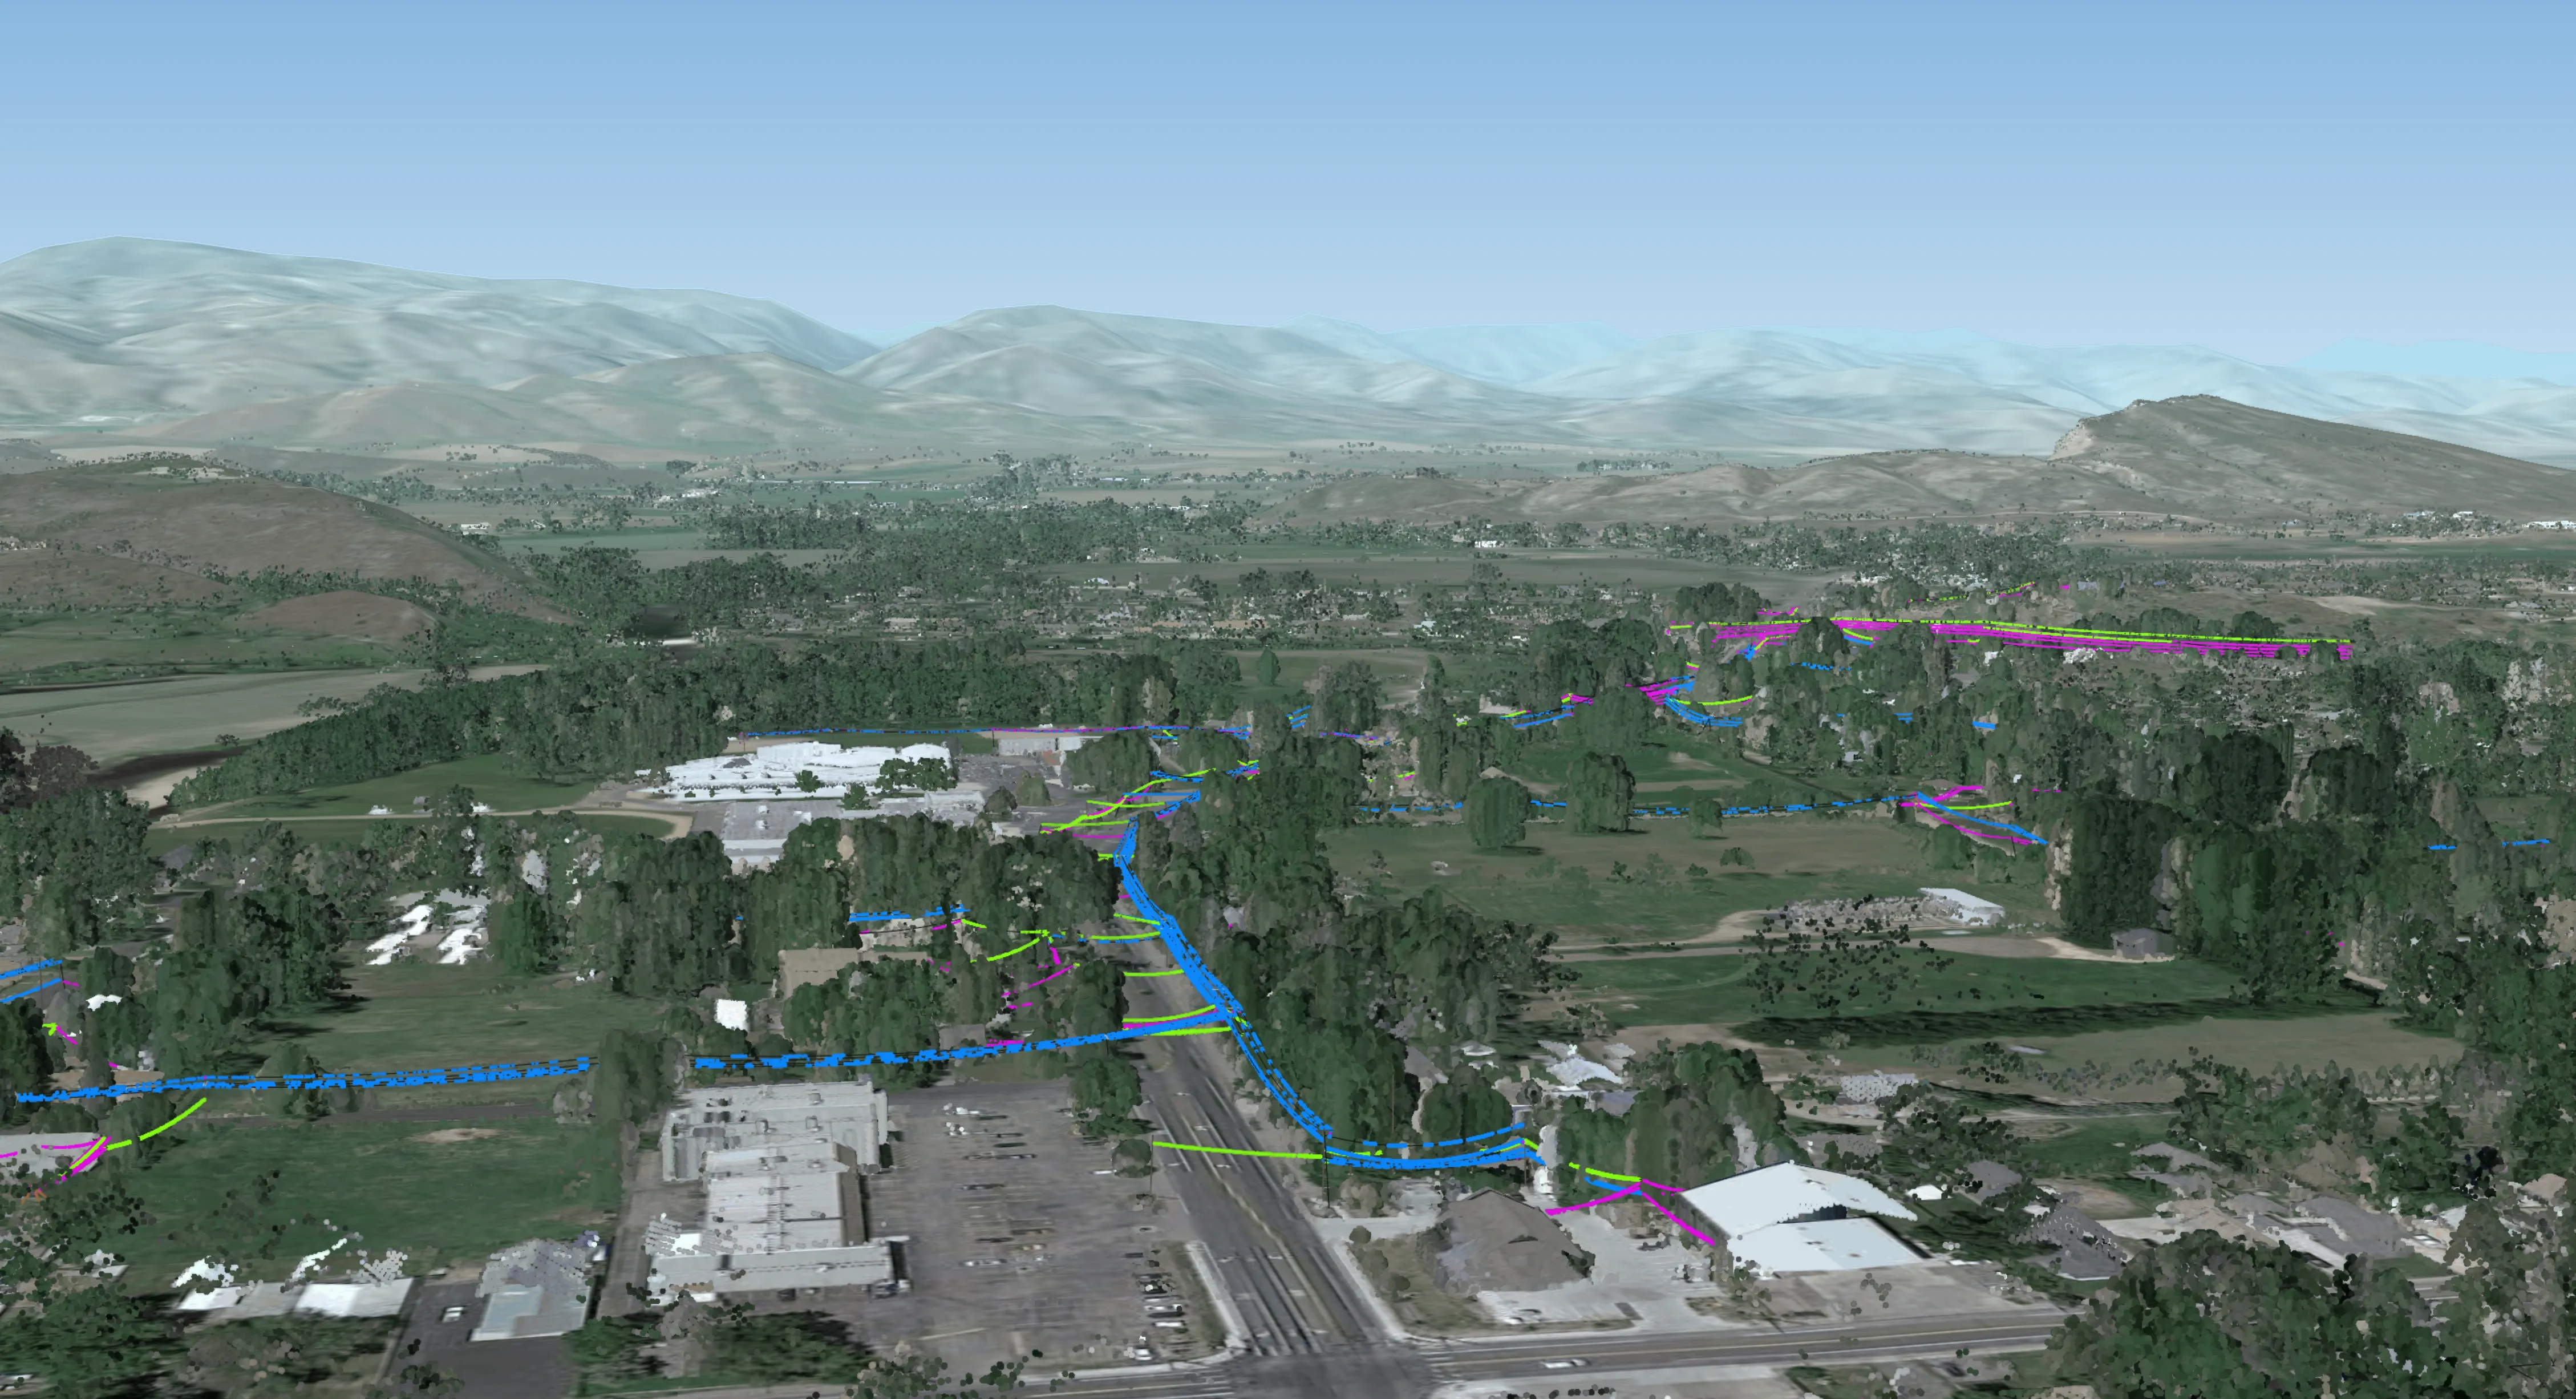
Your operations are only as strong as the data you rely on. Combining accurately classified LiDAR with your GIS generates a powerfully accurate network model. You can confidently navigate life-saving decisions and major grid hardening investments across every corner of your network. This high-fidelity foundation ensures that your digital twin reflects the real-world state of your infrastructure.

View full page
  • Use LiDAR to identify and resolve GIS discrepancies to find the best pathways to resilience.
  • Diagnose standard compliance issues remotely without relying on outdated paper records.
  • Reduce faults with data-driven decision-making across the entirety of your network.

A blueprint to inform your most important decisions

Save your effort for managing real-life risks instead of correcting data issues.

  • Identify and catalog unknown assets with a topological fit function.
  • Model asset distribution, proximity to topological variables, and asset type and purpose.
  • Maintain control over your network and avoid at-fault assertions during audits.
  • Turn a fragmented system of record into a traceable record of accountability.

A single source of truth to direct your operations

Remove unnecessary friction and keep your GIS records up to date automatically.

  • Sanity-check your GIS against high-quality LiDAR scans and satellite imagery.
  • Avoid the wasted time and cost of sending field crews to incorrect GPS coordinates.
  • Replace paper processes with a clean, consistent source of truth.
  • Keep office and field teams working from the same physical data.

Reconcile discrepancies at scale

Transition from manual data entry to an automated, physics-based reconciliation workflow.

  • Align LiDAR and GIS records into a foundation that stands up to regulatory scrutiny.
  • Identify where your physical network differs from your digital database before gaps become liabilities.
  • Start every project with an accurate baseline, from routine maintenance to major rebuilds.
  • Back every decision with verifiable physics to protect your professional standing.
Asset Management

Digital Line Rating

Get the most out of your existing assets by shedding the constraints of blanket assumptions. Digitally re-rate every span in your network based on automatically calculated, granular criteria, including physical asset characteristics, clearance thresholds, and weather stimuli, to determine with certainty what you can achieve using your existing assets, without setting foot in the field. Your AI-assisted digital network model is your roadmap for safely expanding network capacity, improving SAIDI/SAIFI, and showing that you've left no stone unturned to improve reliability.

View full page
  • Automatically score every pole and conductor in your network based on its ability to help or hinder network throughput. Identify limiting elements across your physical assets and prioritize bottleneck remediation to get the most out of your assets.
  • Simulate a range of wind speeds and ambient temperatures across your entire territory to see how much more you can stretch your network in any conditions. Your network model enforces safe clearance thresholds with hard span-by-span rules that act as safety guardrails so you don't have to.
  • Zoom out and build a holistic checklist for safely unlocking every extra mWh of available headroom so you can power through your next peak demand record with certainty.

Maximize gains with granular adjustments that add up

Optimize carrying capacity span-by-span in a digital environment, because not all spans are created equal.

  • Get what you need from every line in your network with the right tools.
  • See what weather and equipment characteristics reach your target line ratings.
  • Evaluate how span-by-span tweaks build up to network-wide capacity expansion.
  • Set realistic goals faster than in the field or with first-generation tools.

Achieve precision beyond weather-adjusted line ratings

Go beyond streaming weather data and sensor inputs, because conditions aren't the only thing driving carrying capacity.

  • Simulate actual line temperature using variables like conductor type, even without sensors.
  • Paint the full picture of what's possible and pursue capacity expansion with certainty.
  • Test-drive tweaks from reconductoring to enhanced vegetation management.
  • Evaluate impact before you invest and bring your team's best ideas to the field.

Diagnose physical carrying capacity bottlenecks across every span

Target the root physical causes of carrying capacity limitations across every span.

  • Find the lesser assets that compromise capacity, from overloaded poles to ill-suited conductors.
  • Make the most of headroom tailwinds from cooler temperatures and breezes.
  • Assess every pole and wire's impact on network productivity.
  • Evaluate asset upgrades by how much incremental throughput they unlock.

Pinpoint the right levers to pull

Understand and rank order all the levers you can pull to increase network capacity using existing assets.

  • Simulate upgrades like pole replacements, reconductoring, and vegetation management.
  • Model them against heat waves, cold snaps, and more for cost-effective expansion.
  • Explore every possibility in a flexible digital environment to surface winning options.
  • Invest in the right upgrades to meet the demands of today and tomorrow.
Asset Management

Risk Impact Scoring

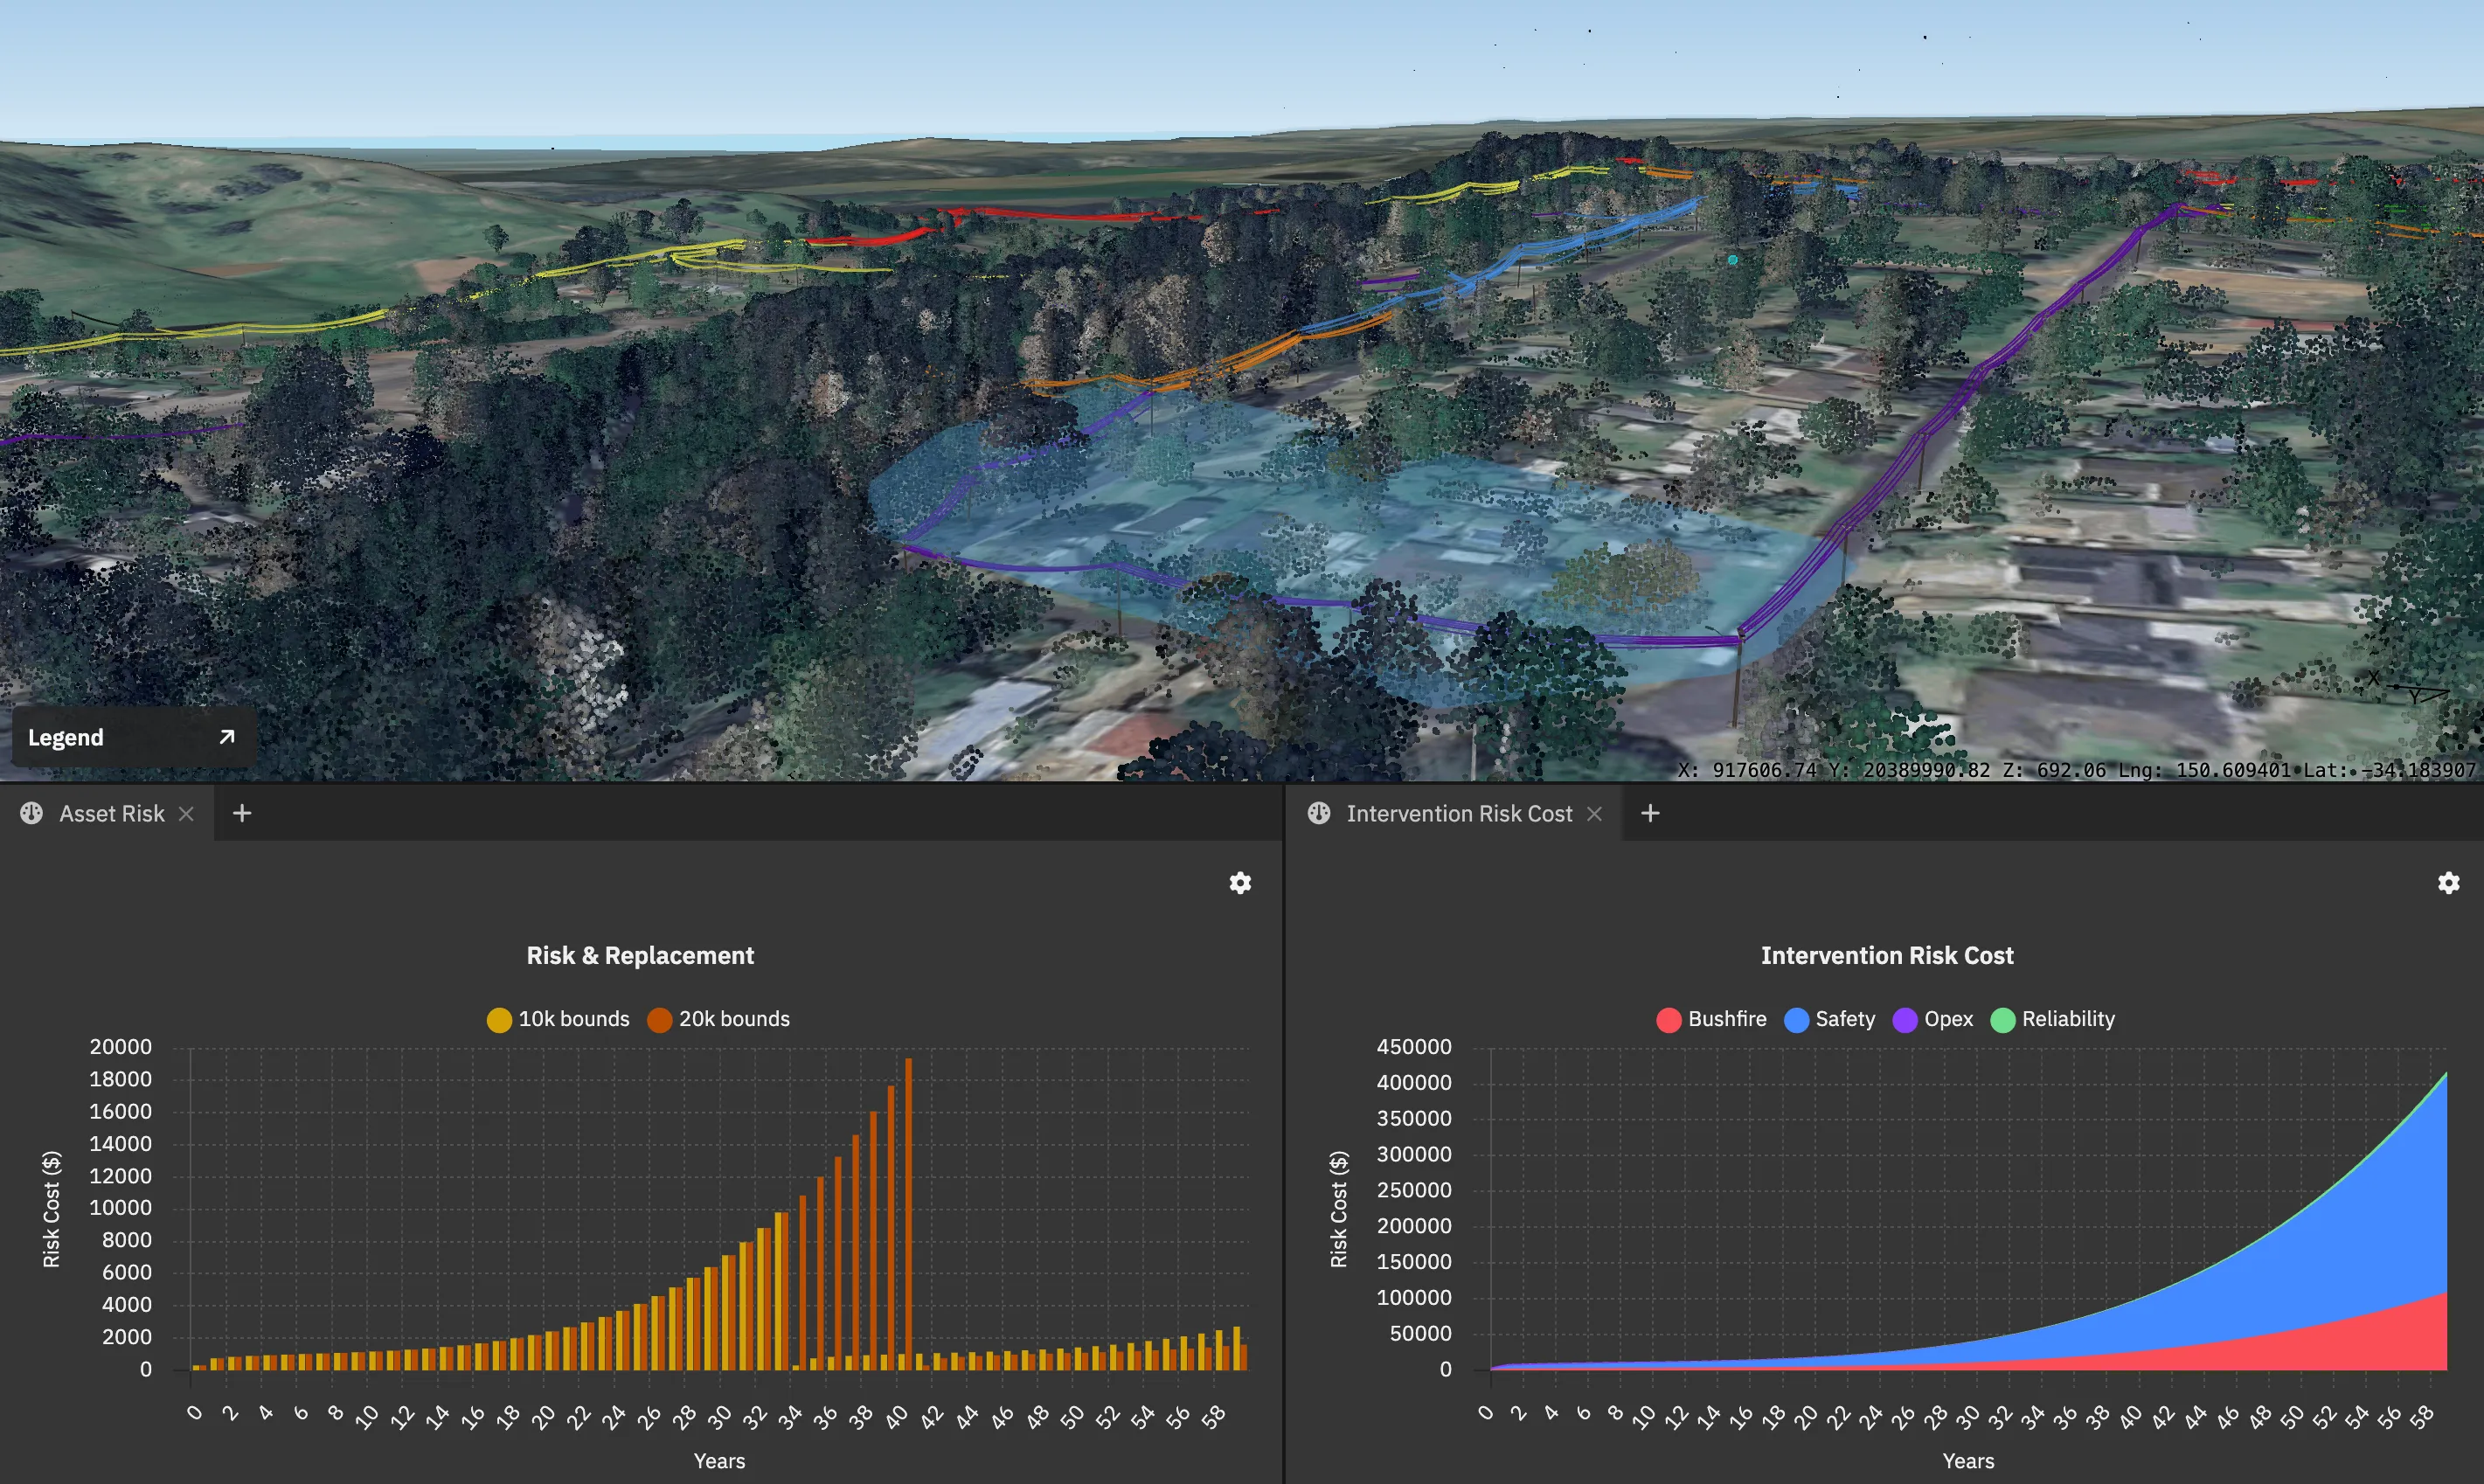
Risk-adjust your priorities. Easily gather the context you need for any risk mitigation or asset upgrade decision without the manual effort that lags critical decision-making windows. Automatically simulate every scenario you need to worry about to identify your best intervention actions. Execute network-wide cost-benefit analyses to clear blockers and make the right decisions faster.

View full page
  • Evaluate risk likelihood, consequence, and cost through a consistent, data-driven lens. Automated, context-rich cost-benefit analyses pave the way to better reliability, resilience, and safety outcomes.
  • Scale your best judgment across your entire network so you can allocate hard-won dollars and quickly navigate critical decisions with confidence every time.
  • Quantify and justify decisions with ease so you can adopt a more proactive lens into the future.

Score every risk in your network by likelihood, even the ones you can't see

Flag and score every risk across your entire network, not just the ones you can see.

  • Move beyond piecemeal inspections that over-index on a small universe of known risks.
  • Score every risk, whether or not it falls in scope of a single field visit.
  • Diagnose how assets will fare under conditions from powerful storms to heat waves.
  • Make critical "what-ifs" an integral part of every risk assessment by simulating key variables.

Put your priorities in the right place

When two equally overloaded poles compete for attention, know which one to address first.

  • Assess risk impact continually, like your most detail-oriented analyst.
  • Reflect every asset's exact physical context and configuration.
  • Weigh factors from high-traffic intersection proximity to elevation geometry and nearby water.
  • Distinguish the assets that cause a hiccup from those that cause havoc.

Fast-forward to your best intervention option

Know exactly which poles to replace to improve SAIDI/SAIFI, beyond this year's replacement cycle.

  • Navigate cost-benefit trade-offs for every risk with ease.
  • Simulate multiple intervention options automatically to land on the winner.
  • Move fast enough to decide within the required timeframe, saving costs and red tape.

See your network as one physics-enabled digital twin

Book a personalized demo and see how leading utilities defend every replacement, deferral, and inspection decision.