Solutions

Resiliency & Reliability

Understand the customer impact of interacting risks across the network, and prioritize actions based on physics-backed outcomes

Improve system-level resiliency, not just individual asset risk

Prioritize mitigation work based on how asset condition and behavior, vegetation proximity, and environmental conditions interact across the network in every scenario.

Show which feeders need hardening most and why

Prove hardening work lifts system resiliency, not just shifts risk

Know how risk, spend, and response plans change under each scenario

The problem

Most resiliency programs evaluate risks in isolation, but failures emerge at the network level

Vegetation teams look at trees, engineering teams look at loading, emergency teams look at response. The silos are logical. The problem is that HILF events don't respect them. Failures come from conditions interacting across the network, not from a single threshold crossed in a single place:

  • Vegetation falling at just the right angle on an already over‑utilized pole
  • Trimming in a windy corridor that unintentionally increases exposure and failure risk nearby
  • A hardened pole that simply shifts mechanical stress to adjacent spans

You can have a perfect lens into vegetation, structure loading, and accessibility risk, and still have a very limited understanding of actual network resiliency.

Mitigation work can successfully reduce individual risk vectors while leaving the overall resiliency and reliability risk profile largely unchanged.

From localized risk mitigation to network-wide outcome modeling

From To
Workflow-based risk management System-wide risk prioritization
Time-based inspection cycles Scenario-based risk inspections
Output-driven mitigation planning Outcome-based resiliency planning

Ask the whole network, not just the slice you can see

"Which feeders would be hardest hit in >60 mph NW winds?"

Make resiliency decisions based on modeled consequences

Distinguish BAU risk from consequential customer impact by spotting where conditions combine into failure exposure, even when assets look stable.

Anticipate second and third-order consequences from prevention to restoration, seeing how layered risks shape crew access and where failures escalate.

Justify investments with simulation analyses tied to auditable scenario results that prove hardening reduced risk rather than moved it.
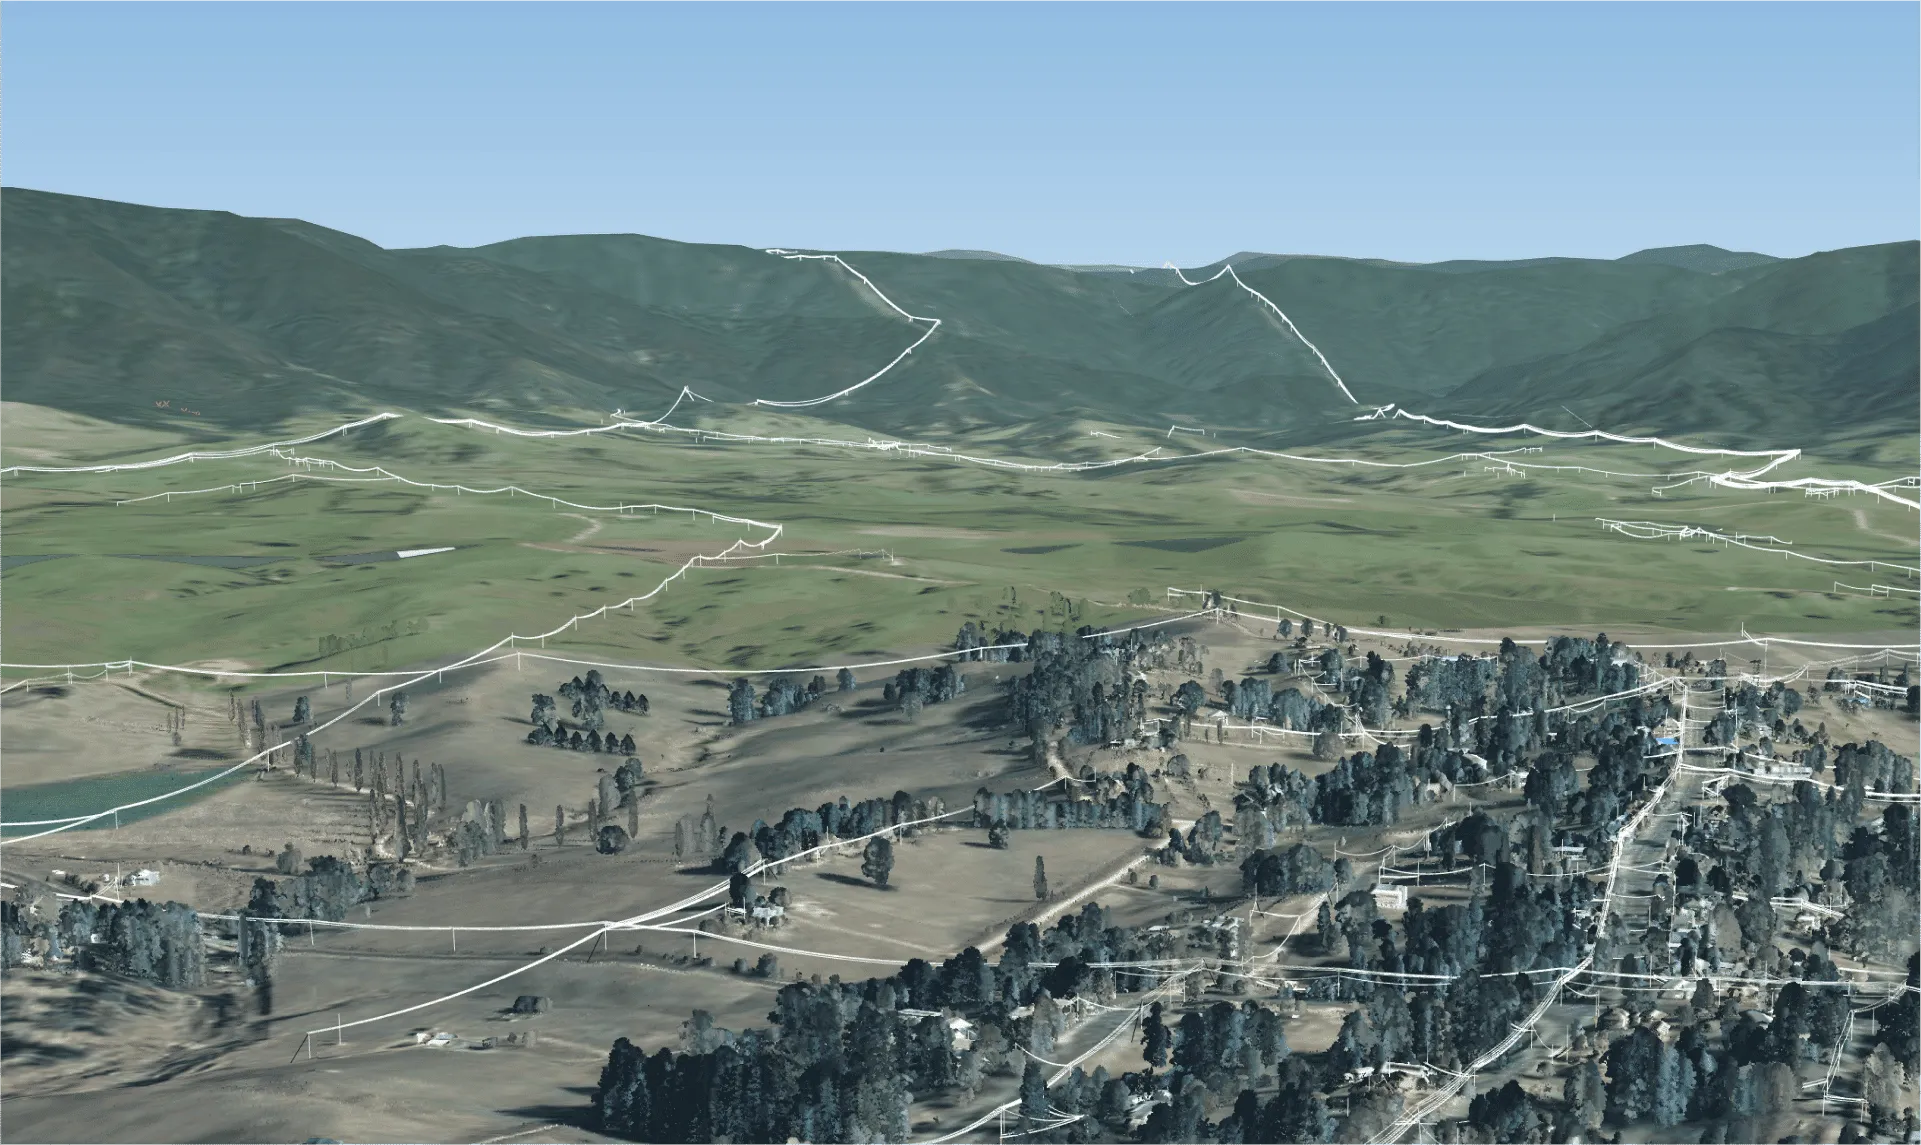
Build back faster and better with engineering-grade guardrails that keep frontline decisions safe and compliant under pressure.

Real-world applications

Storm Arwen backcast and remediation comparison

Storm Arwen backcast and remediation comparison
United Kingdom
100 Before
75 After guy-wires
−25% projected pole failures

The Challenge

Following a historic storm, the utility needed to determine how the network would fare in a repeat of the same event, including >100 mph winds and atypical wind directions that drove widespread failure.

The Analysis

Despite extensive hardening work, the backcast revealed many spans were still vulnerable to vegetation fall-in, flooding, and high winds. The team categorized at-risk spans by root cause, then simulated and ranked a range of remediation options.

The Outcome

Targeted guy-wire placement on specific spans reduced projected pole failures by 25%, a faster, lower-cost path to meaningful resiliency improvement than wholesale pole replacement.

From approximated visualization to precise simulated behavior

From To
Statistical historical failure patterns Drillable, physics-backed risk scores
Disconnected asset & environment data Modeled interaction between assets & surroundings
Static engineering assumptions Simulated loading scenarios

Explore all workflows

Resiliency & Reliability

Forecast and Backcast Resilience

Forecast how every asset in your network will respond to heat waves, hurricanes, hail storms, and everyday loading. Pinpoint the upgrades that move the needle at the individual asset level, then backcast performance to show exactly how those changes improve reliability. Let the model handle the calculations so you can explore every scenario and build fast, defensible consensus for your plan.

View full page
  • Simulate how severe weather and operating conditions will impact your assets so you see where your network is most vulnerable and can prioritize the right upgrades.
  • Quantify resilience improvements at the individual asset level using metrics such as pole lean and cable clash rates, and connect them to system outcomes like SAIDI and SAIFI.
  • Automate ROI analyses across pre and post improvement states by backcasting upgrade impacts so you can forecast, deliver, and measure resilience gains and validate key decisions.

Generate a fast recovery strategy for any scenario

Turn any scenario into a clear recovery roadmap by bringing dangerous conditions into your model before they arrive in the field.

  • Prioritize targeted upgrades instead of applying broad reinforcement cycles.
  • Translate asset level metrics like conductor creep, line tension, and pole loading into SAIDI, SAIFI, and safety outcomes.
  • Show how the same storm would play out before and after planned upgrades to prove your plan reduces risk.
  • Move from generic resilience statements to concrete, testable strategies.

Mobilize restoration and repair crews faster

Find the loading window that supports productivity without crossing safety limits by stress testing every pole against mechanical and environmental variables.

  • See where current and proposed attachments push loading toward unsafe levels.
  • Identify specific structures that need reinforcement or redesign before you add more equipment.
  • Give repair crews a clear view of which poles are most likely to fail so they can stage resources.
  • Build a network that carries more without leaving you exposed in the next storm.

Validate every asset upgrade

Use an individual asset health view to see which structures, spans, and lines truly require attention in your conditions.

  • Predict exactly which poles, spans, or conductors are likely to fail in defined scenarios.
  • Replace or reinforce only the assets that limit system performance instead of entire classes or regions.
  • Justify every upgrade by comparing pre state performance in extreme conditions against the strengthened post state.
  • Turn upgrade proposals into evidence backed recommendations instead of line items that are hard to defend.

Demonstrate how every O&M line item improves resilience

Use scenario based modeling to show how vegetation work, inspections, and other O&M activities reduce real risk instead of just ticking compliance boxes.

  • See which spans and structures face the highest strike and clash risk, including outside standard rights of way.
  • Support vegetation and maintenance decisions with hard data about community risk, not just distance rules.
  • Run pre and post maintenance scenarios to show improved clearance, reduced clash incidents, or prevented outages.
  • Defend O&M budgets and navigate difficult ROW discussions with hard data.
Resiliency & Reliability

Equipment Inspections

Stress-test and diagnose every single asset across the full lifecycle from repair, replacement, and reconfiguration without setting foot in the field and focus field time on validation and triage. Digitally inspect your equipment so you can see how every asset will respond to simulated gale force winds, flash floods, and more when you can't have your team out for the real thing.

View full page
  • Prevent more outages and safety incidents by keeping your equipment in its best shape.
  • Stop manually answering the same hundreds of questions per pole. Leave the manual heavy lifting to AI and empower your team to focus on the right questions about improving resilience.
  • Be the first to know about critical vulnerabilities by simulating hundreds of mechanical and environmental variables, from heat waves to line tensioning, so you can see the unforeseen and take preventive action.

Replace, repair, or reconfigure?

Look to your network model for a 90% automated triage plan to get every asset in shape.

  • See which equipment needs attention and diagnose the right next step for each asset.
  • Choose whether to replace a concrete pole with steel, add a stay, or relocate.
  • Measure pole height, lean, bend, and conductor tension with precision at scale.
  • Stress-test your equipment to find and fix your weakest links.

Get pole load "just-right"

Find the ideal pole load so your efficiency never becomes the enemy of reliability or safety.

  • Maximize pole utilization for broadband joint use and expanding carrying capacity.
  • Avoid the catastrophic consequences of pushing pole utilization too far.
  • Stress-test every pole against hundreds of mechanical and environmental variables.
  • Find the right loading formula that supports productivity without risking failure.

Flag buddy poles

Automatically detect and flag double poles so you can maintain every asset, not just the ones in your GIS.

  • Find poles you cannot maintain today because you are unaware of them.
  • Detect double poles by height, type, and spatial relationships in your network model.
  • Get a clear lay of the land across every asset you are liable for.
  • Allocate maintenance work orders with confidence across all assets that need attention.

Safeguard against conductor clashing

See exactly where clashing and galloping are most likely and most severe, without relying on field surveys.

  • Track conductor behavior that changes on a dime in different conditions.
  • Pinpoint tension imbalances and structural flaws across every conductor in your network.
  • Layer on prime wildfire conditions or a hailstorm to test each span.
  • Act against short-circuiting and equipment failure before they happen.

Understand cumulative asset stress

Factor in how asset integrity changes over time as equipment experiences cumulative stress like cable creep.

  • Go beyond how assets stand today or fare in high winds, ice, or heat.
  • Simulate creep curves in custom increments based on the actual age of assets.
  • Layer in as many other variables as you see fit for thorough inspections.
  • Make the best lifecycle decisions with a view of stress over time.

Stay ahead of asset failure with network-wide FEA

Calculate strain and stress on all network components with AI-assisted FEA in your digital model.

  • Cover poles, spans, cross-arms, insulators, pins, and braces.
  • Detect hidden risks and prioritize replacements and repairs.
  • Evaluate which poles are at capacity and which can carry more load.
  • Keep every asset at peak performance, no matter where you are in the lifecycle.
Resiliency & Reliability

Vegetation Management

Fair weather field inspections only show vegetation on its best behavior. You can now simulate high winds, rainfall, and extreme temperatures to reveal actual interruption and wildfire risks. This risk-based approach empowers your team to focus on proactive triage and remediation. You can move away from reactive, fragmented work orders and start managing your network with total visibility.

View full page
  • Inspect every tree in your network with a few clicks instead of sampling small segments at a time.
  • Upgrade from manual guesstimates to work orders with unparalleled accuracy to complete work 50% faster.
  • Get precise clearance reports into field hands in days while justifying every budget decision with traceable logic.

Assign clearance reports in days, not months

Prioritize encroachment, fall-in, and grow-in risks more effectively to accelerate remediation cycles.

  • Audit your entire network digitally instead of just what you see during a site visit.
  • Trade heuristic assumptions for physics-based precision when prioritizing spans.
  • Confirm every P1 is a legitimate threat rather than a false alarm.
  • Spend field time and contractor budget on the highest-consequence risks.

Reduce outages and improve reliability metrics

Cut outages by moving from cycle-based trimming to risk-based maintenance.

  • Simulate high winds and ice storms that unravel normal-course clearance logic.
  • See exactly how and where to respond without setting foot in the field.
  • Surface lookalike trouble spots prone to outages by equipment and environment.
  • Improve SAIDI and SAIFI by neutralizing threats before they trigger a lockout.

Combat wildfire ignition risk

Evaluate ignition risk across every span from a defensible digital model, because manual estimates cannot keep pace with today's fire environments.

  • View how vegetation responds to high winds and equipment sag from your desk.
  • Stop second-guessing whether a P1 was missed or field time was misdirected.
  • Protect your standing and community with a traceable record for every span.

Codify "urgent" and "done" across your workforce

Define consistent urgency criteria once and enforce it network-wide through your digital model.

  • Eliminate unnecessary repeat field visits to check work order status.
  • Use your network model as a shared source of truth for all work in flight.
  • Transform clearance reports into durable digital artifacts, not papered work orders.
  • Reduce barriers to action and drive down total O&M costs.

Bulletproof your vegetation budget

Make budgeting a data-driven exercise when you know exactly what needs to be done and when.

  • Secure your budget with total visibility across priorities and underlying costs.
  • Understand financial trade-offs of mitigating risks to negotiate with contractors.
  • Justify every line item with defensible engineering and the efficiencies you unlock.
  • Turn your budget from a point of friction into a strategic asset.
Resiliency & Reliability

Clearance Analysis

Your ability to meet safety mandates should not depend on unpredictable field variables. Maintain constant situational awareness across all assets to see exactly what they are in danger of touching. You can simulate stressors like extreme weather or high-heat load scenarios to understand how every span responds. This physics-based view empowers you to prepare for the unexpected without sending crews into the field.

View full page
  • Identify and mitigate clearance hazards with more accuracy than manual field measurements allow.
  • Reduce violations by customizing thresholds throughout your network to provide a safety buffer.
  • Anticipate future clearance hazards under extreme sag and sway to ensure you are never caught off guard.

Sharpen your risk detection abilities

Pinpoint current and future clearance risks before they manifest in the physical world.

  • Cover third-party structures, telco lines, and private cables.
  • Analyze ground elevation and vegetation encroachment alongside your own line crossings.
  • Move from sampling to total, network-wide visibility.
  • Manage the risks that traditional inspections often overlook.

Violation-proof your network

Ensure your network meets all legal and regulatory requirements to avoid costly violations.

  • Assess clearance requirements near roads, railways, and public pathways instantly.
  • Raise the safety bar with custom clearance thresholds reflecting your engineering judgment.
  • Prove compliance to regulators with a traceable record of accountability.

Spot risks for today and tomorrow

Identify which weather or load circumstances present the greatest threat by simulating physical scenarios.

  • Assess clearance risk network-wide without increasing field-related safety incidents.
  • Target field visits to prioritize removal of high-consequence hazards.
  • Replace costly top-to-bottom manual surveys with targeted, data-driven remediation.
  • Improve both decision velocity and community safety with verifiable physics.

See your network as one physics-enabled digital twin

Book a personalized demo and discover how leading utilities are transforming their operations.