


Show which program removes the most risk per dollar across undergrounding, covered conductor, pole replacement, and vegetation work, all measured the same way.
Solutions
Risk & Value Optimization
Score every intervention on risk removed per dollar, and show the calculation behind the ranking you filed.

Rank every dollar by the risk it actually removes
Risk spend efficiency cases live or die on the denominator. Model expected failures per structure from real geometry and simulated conditions, then compare what each option removes, span by span and dollar by dollar.
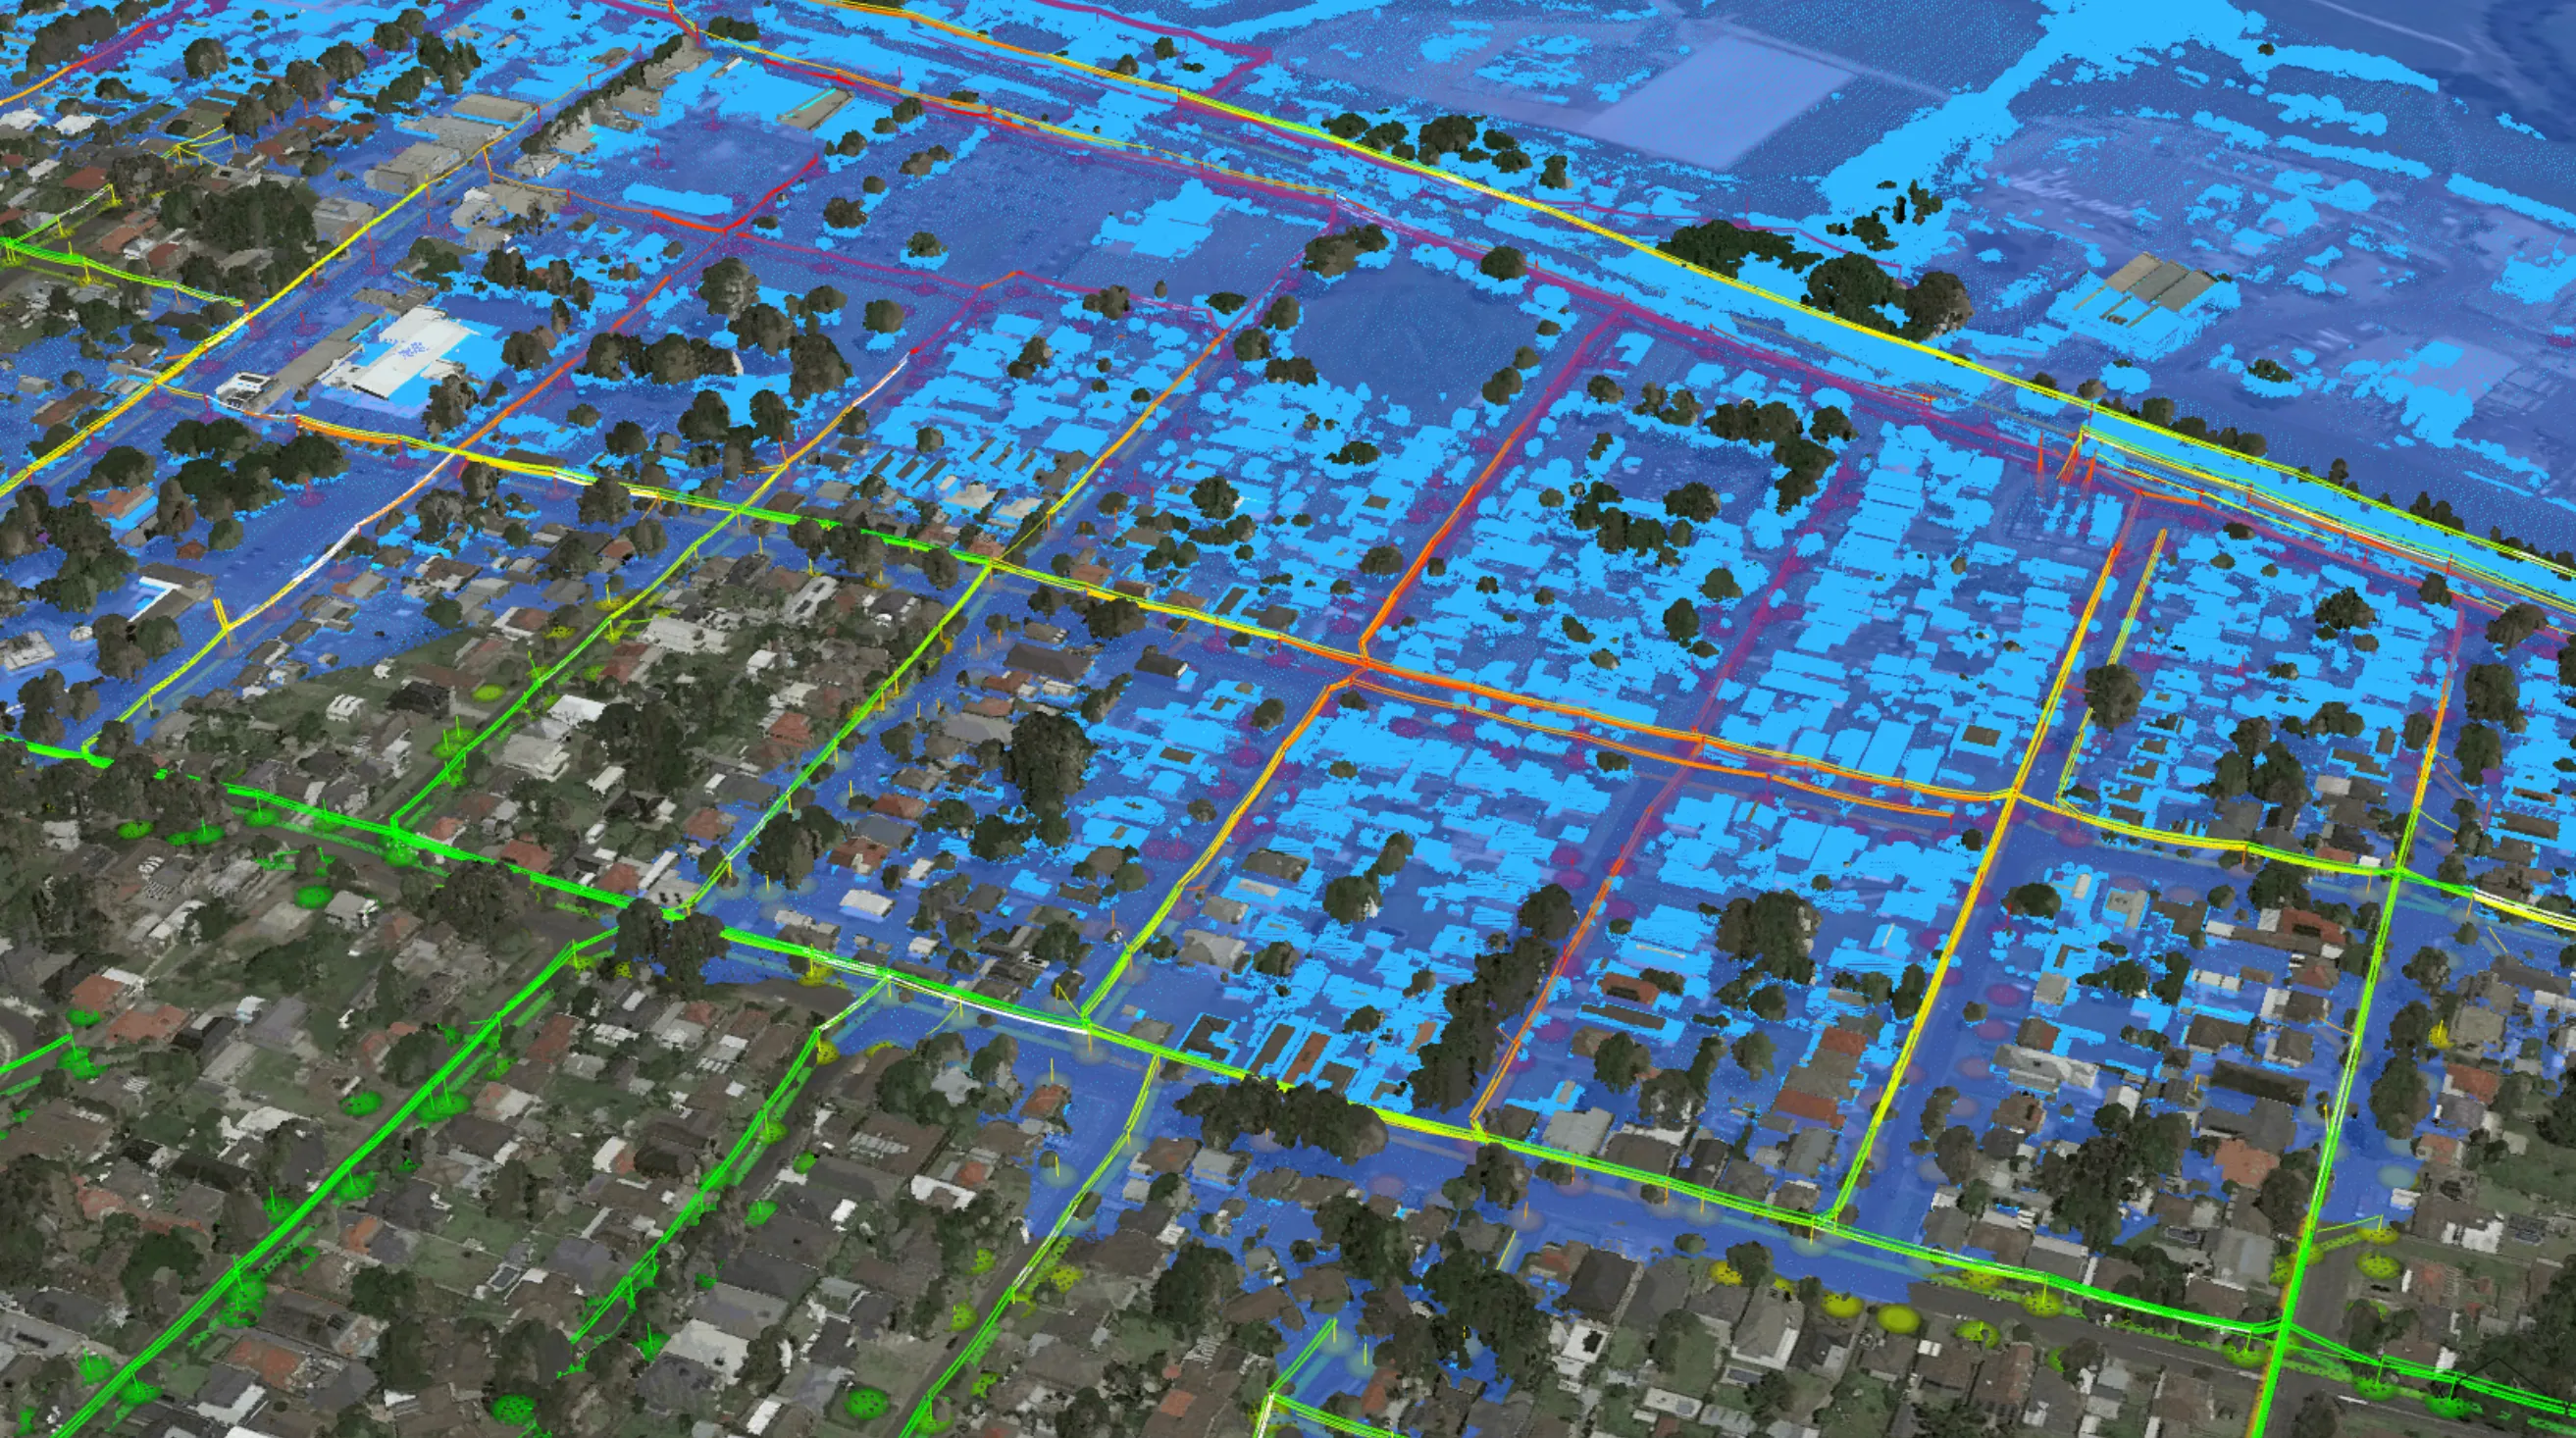
Compare undergrounding, covered conductor, and replacement on one basis so the ranking rests on modeled risk removed per dollar, not on whichever business case was built first.
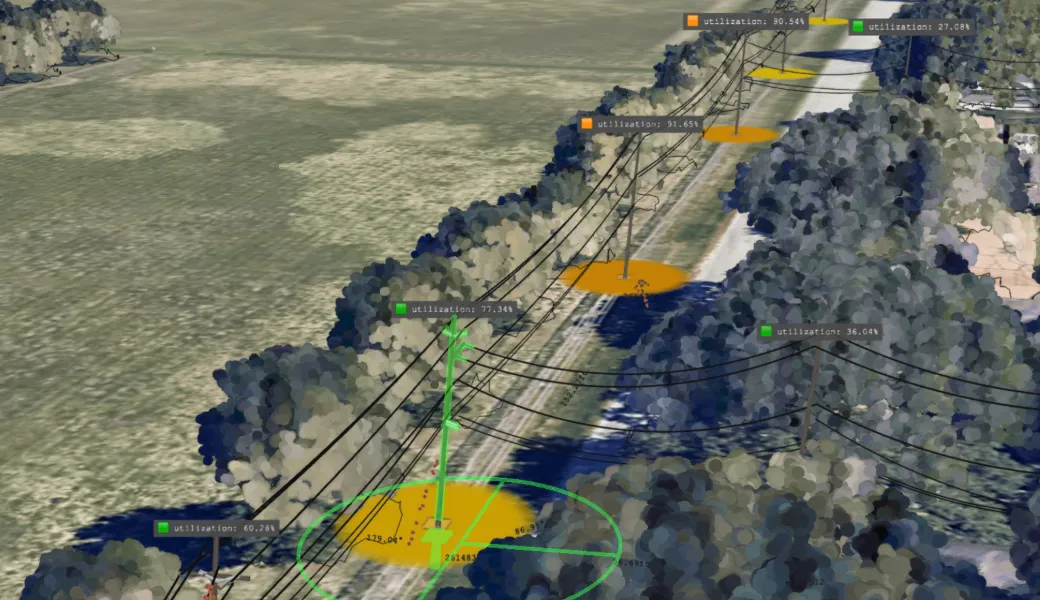
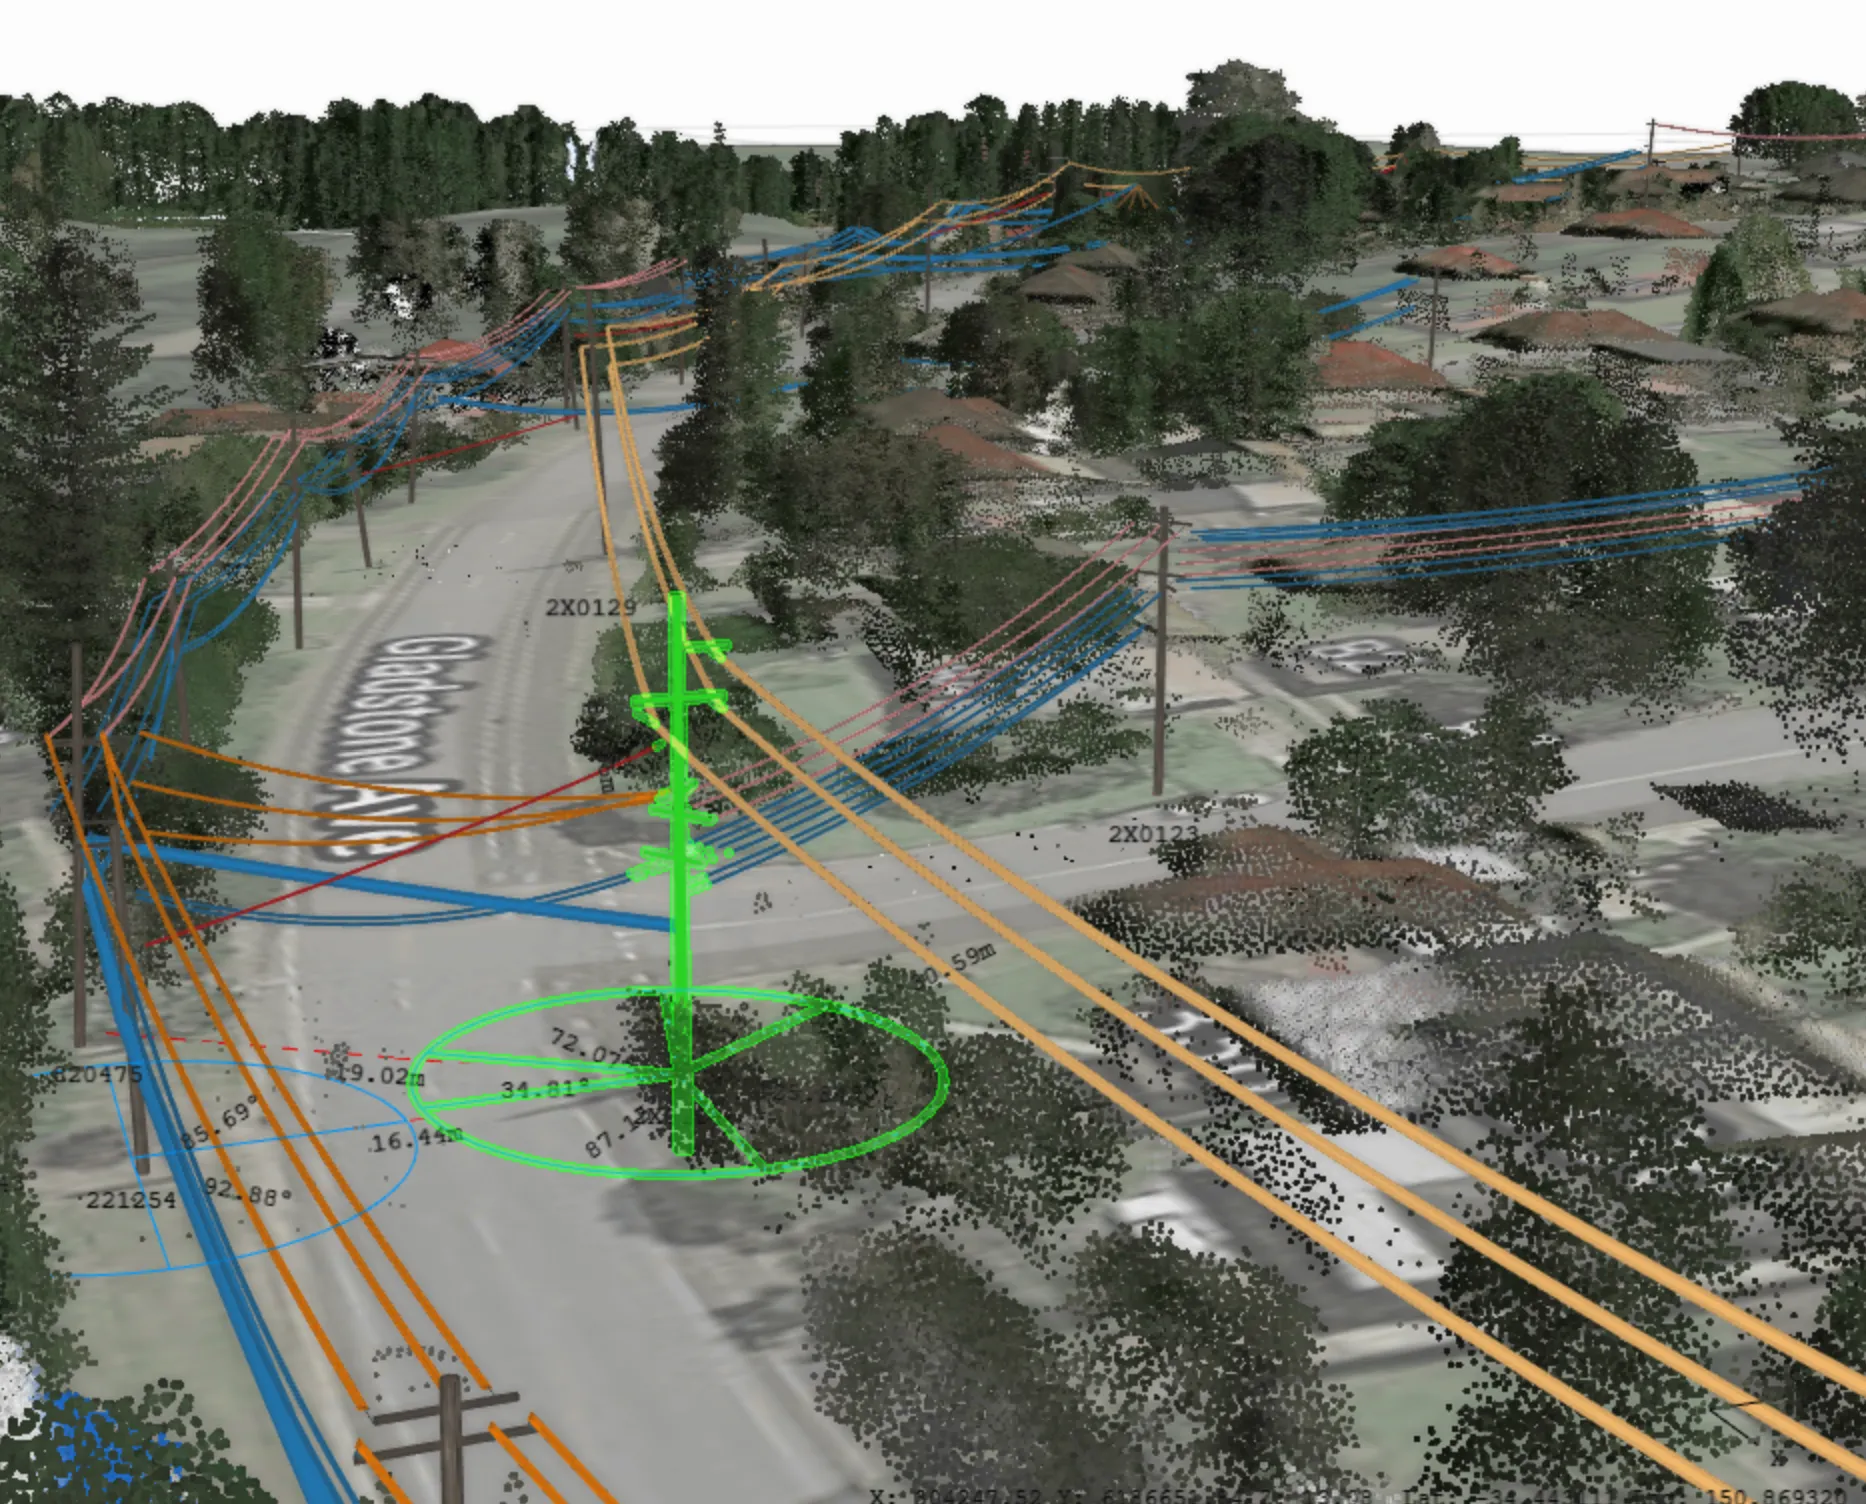
Score consequence, not just condition separating the overloaded pole on a hospital feeder from the identically loaded one on a rural spur.
Test the program before you file it seeing what the same budget removes under a different mix, then re-running it when cost inputs move.
The problem
Models built on historical failures can't price the failure that hasn't happened yet
Statistical models rank assets by what has broken before. That holds until someone asks why this program, at this cost, in this order. Answering needs a defensible number for every option, and the numbers take a full cycle to produce:
- A cost-benefit case rebuilt by hand each time the program mix changes
- Consequence scores that weigh a rural spur the same as a hospital feeder
- Six weeks to compare three options, on a submission due in four
So the option you file for is the one you could defend fastest, not the one that removes the most risk.
And when the ranking gets challenged, the working sits across spreadsheets nobody outside the team can follow.
From ranking assets to pricing outcomes
From To
Historical failure rates Simulated failure probability
Program-level cost-benefit Per-structure spend efficiency
One option defended Every option scored
Months of manual analysis Options compared in days
Make capital calls you can defend line by line
When likelihood, consequence, and cost sit in one model, you can rank the options, show the working, and re-run all of it when the assumptions move.

Separate the assets that cause a hiccup from those that cause havoc by scoring customers served, crew access, terrain, and what sits downstream of each structure.
Answer the follow-up question while the review is still in the room re-running the ranking against a revised cost input or weather assumption in hours, not another analysis cycle.
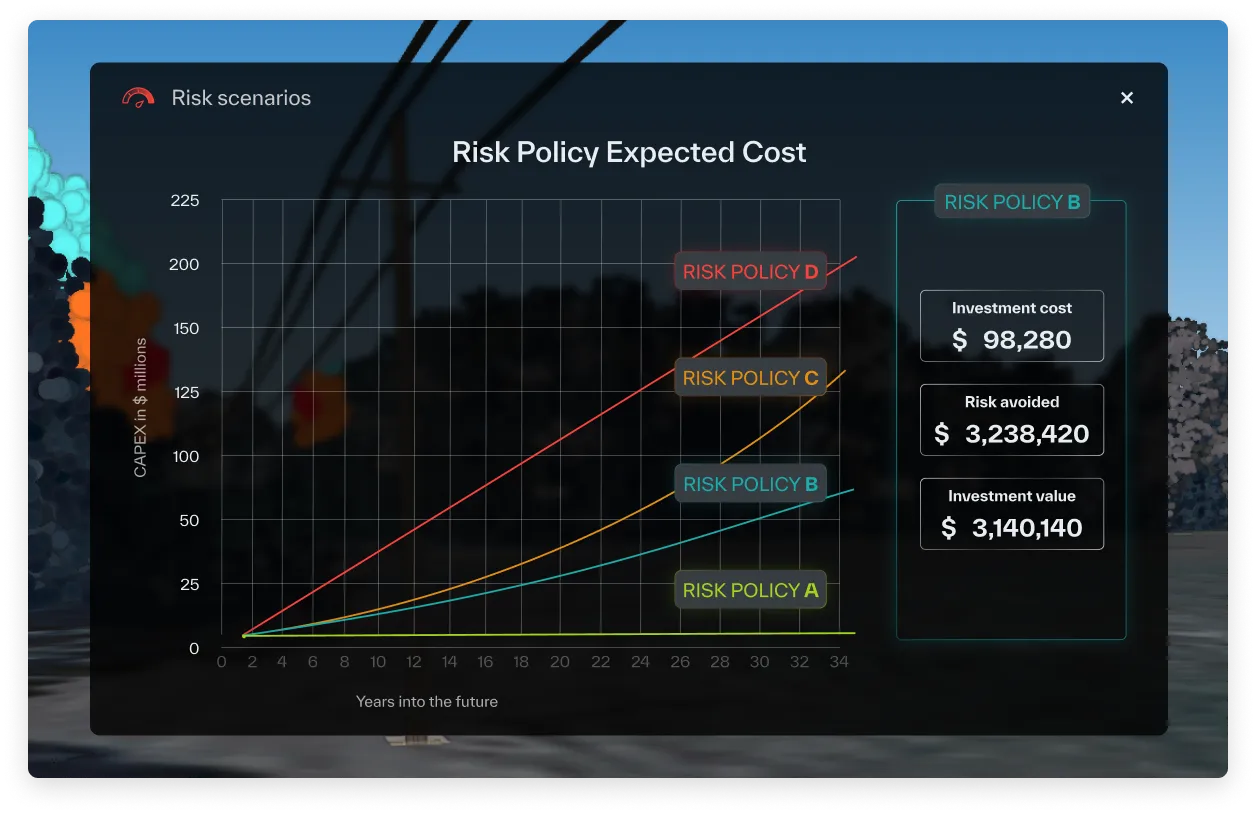
Attach the working to the filing with load cases, weather scenarios, and cost inputs traceable behind every option you ranked.
Real-world applications
Cutting 25,000 condemned poles down to 4,000
Prioritizing a $1.5 billion capital plan on modeled risk
 United States
 100 Age-based condemnation
16 Physics-based review
The Challenge
A regulatory commitment to remediate high-risk poles produced an estimate of 25,000 to 30,000 replacements, backed by age tables and qualitative field reports. The cost became a point of contention with the regulator.
The Analysis
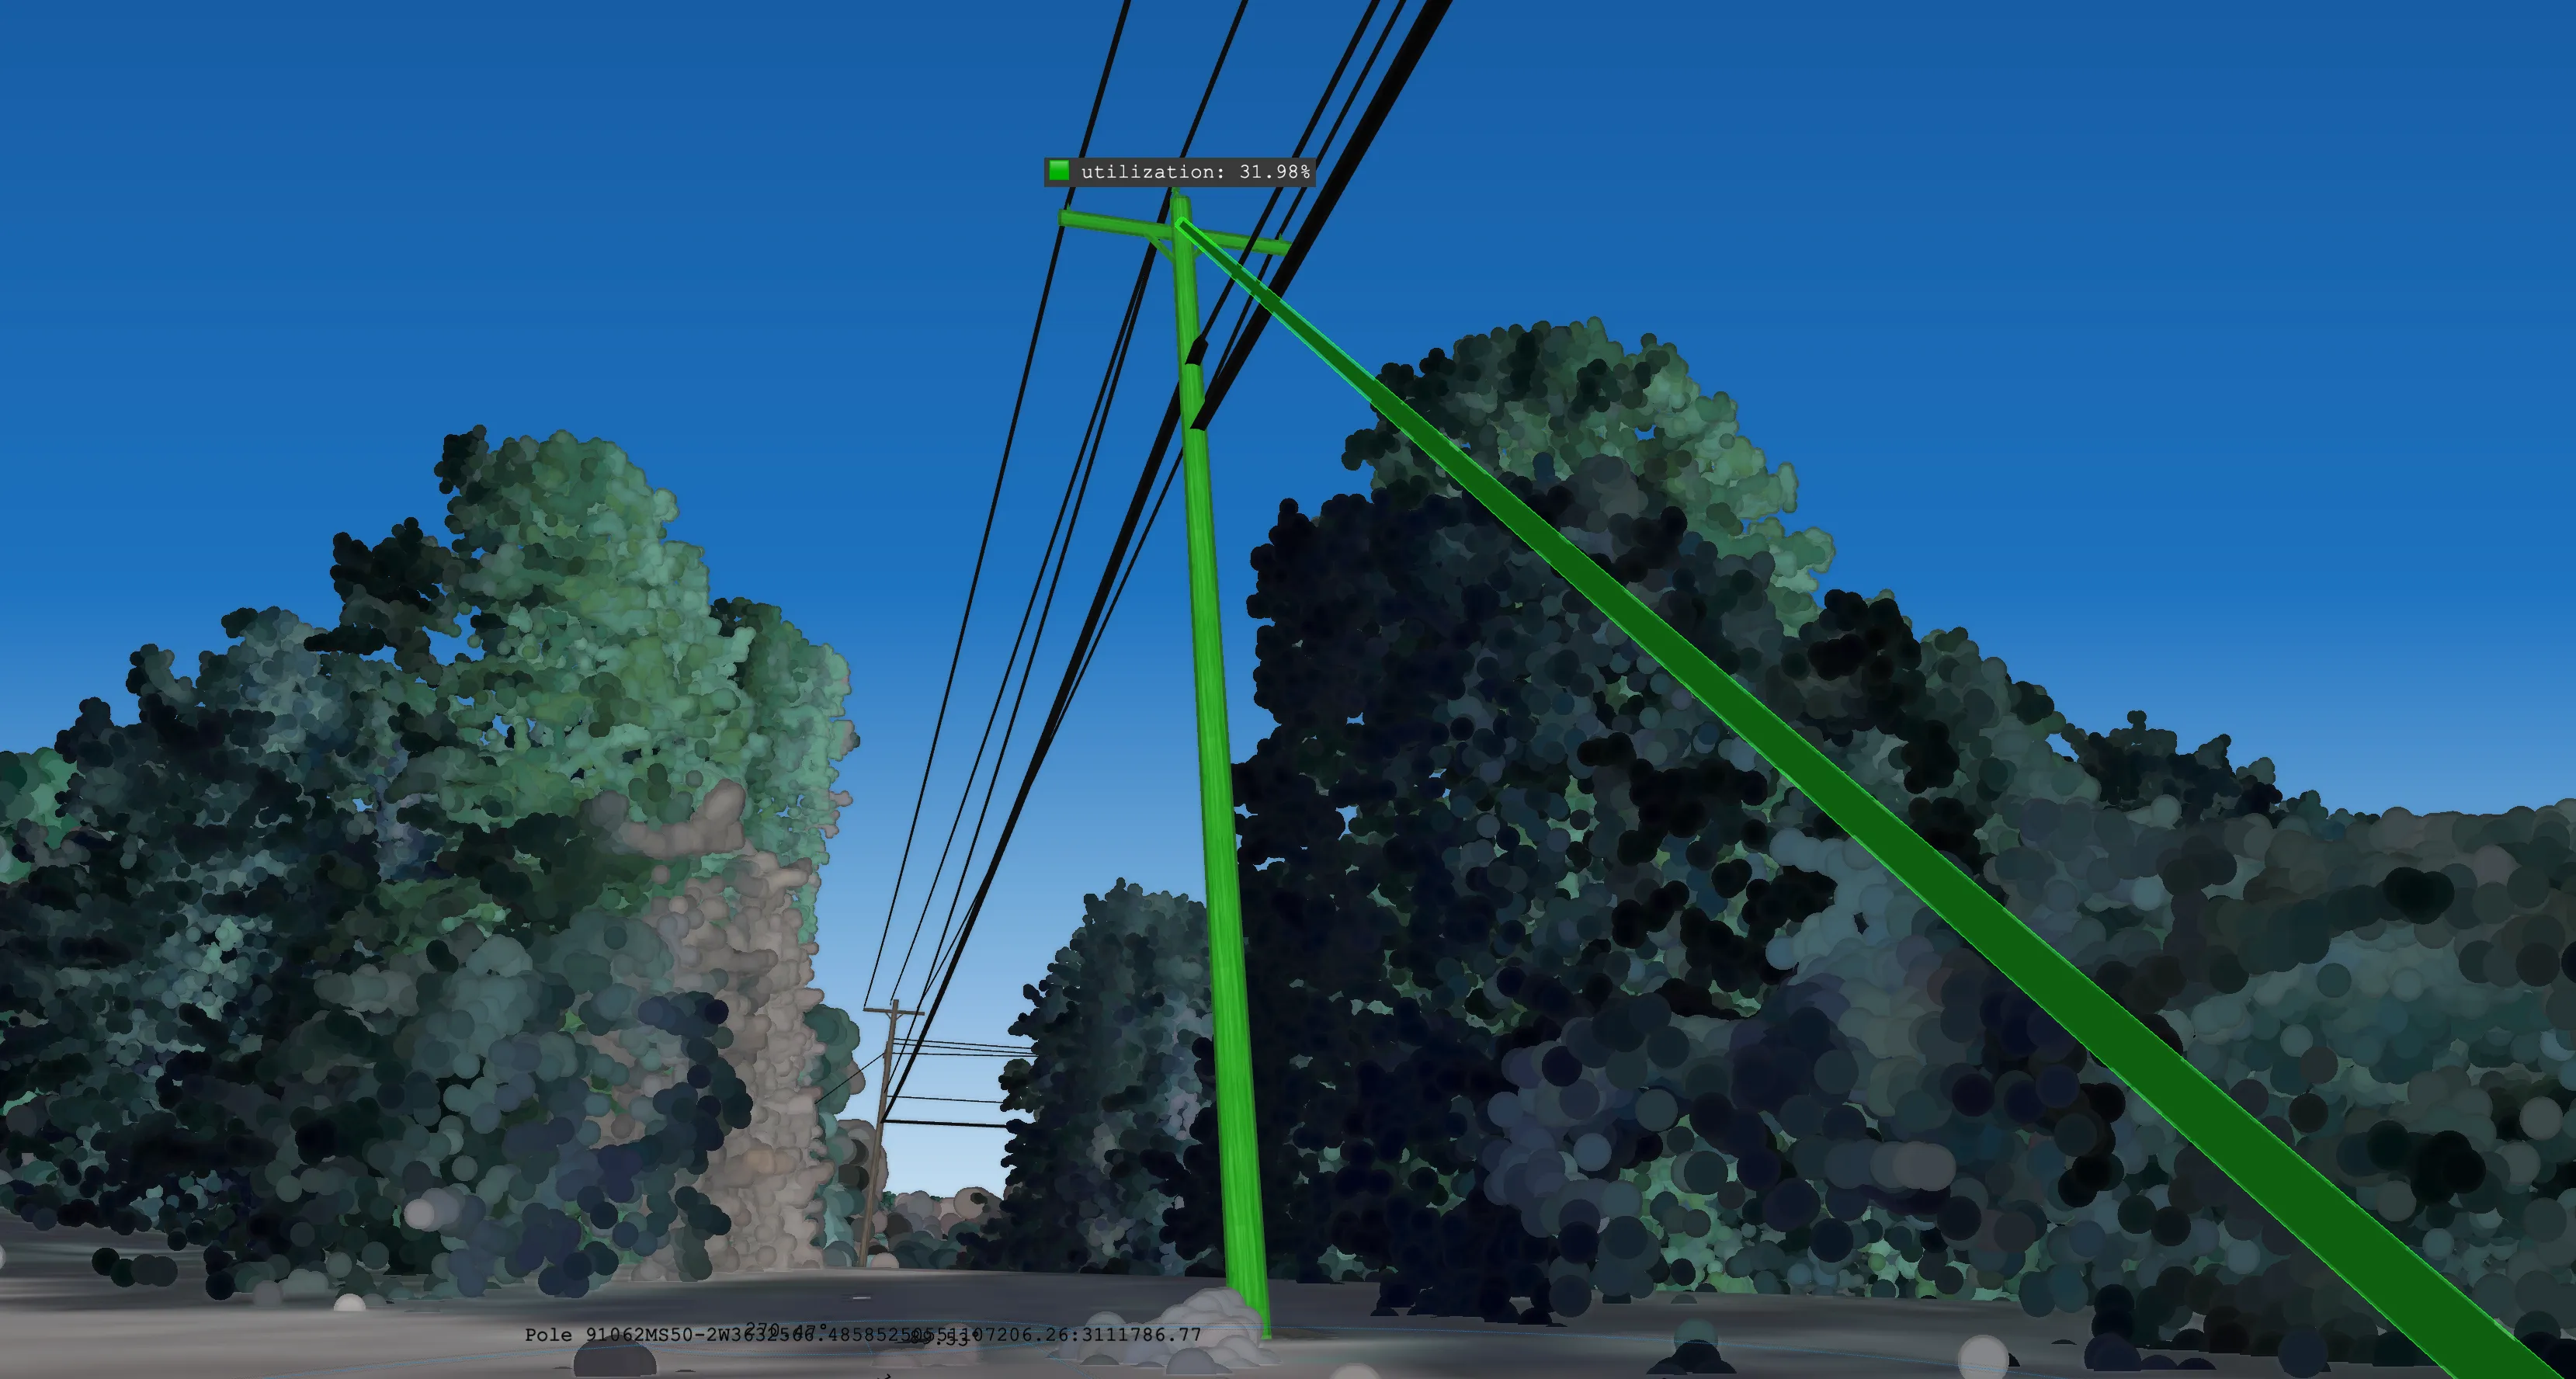
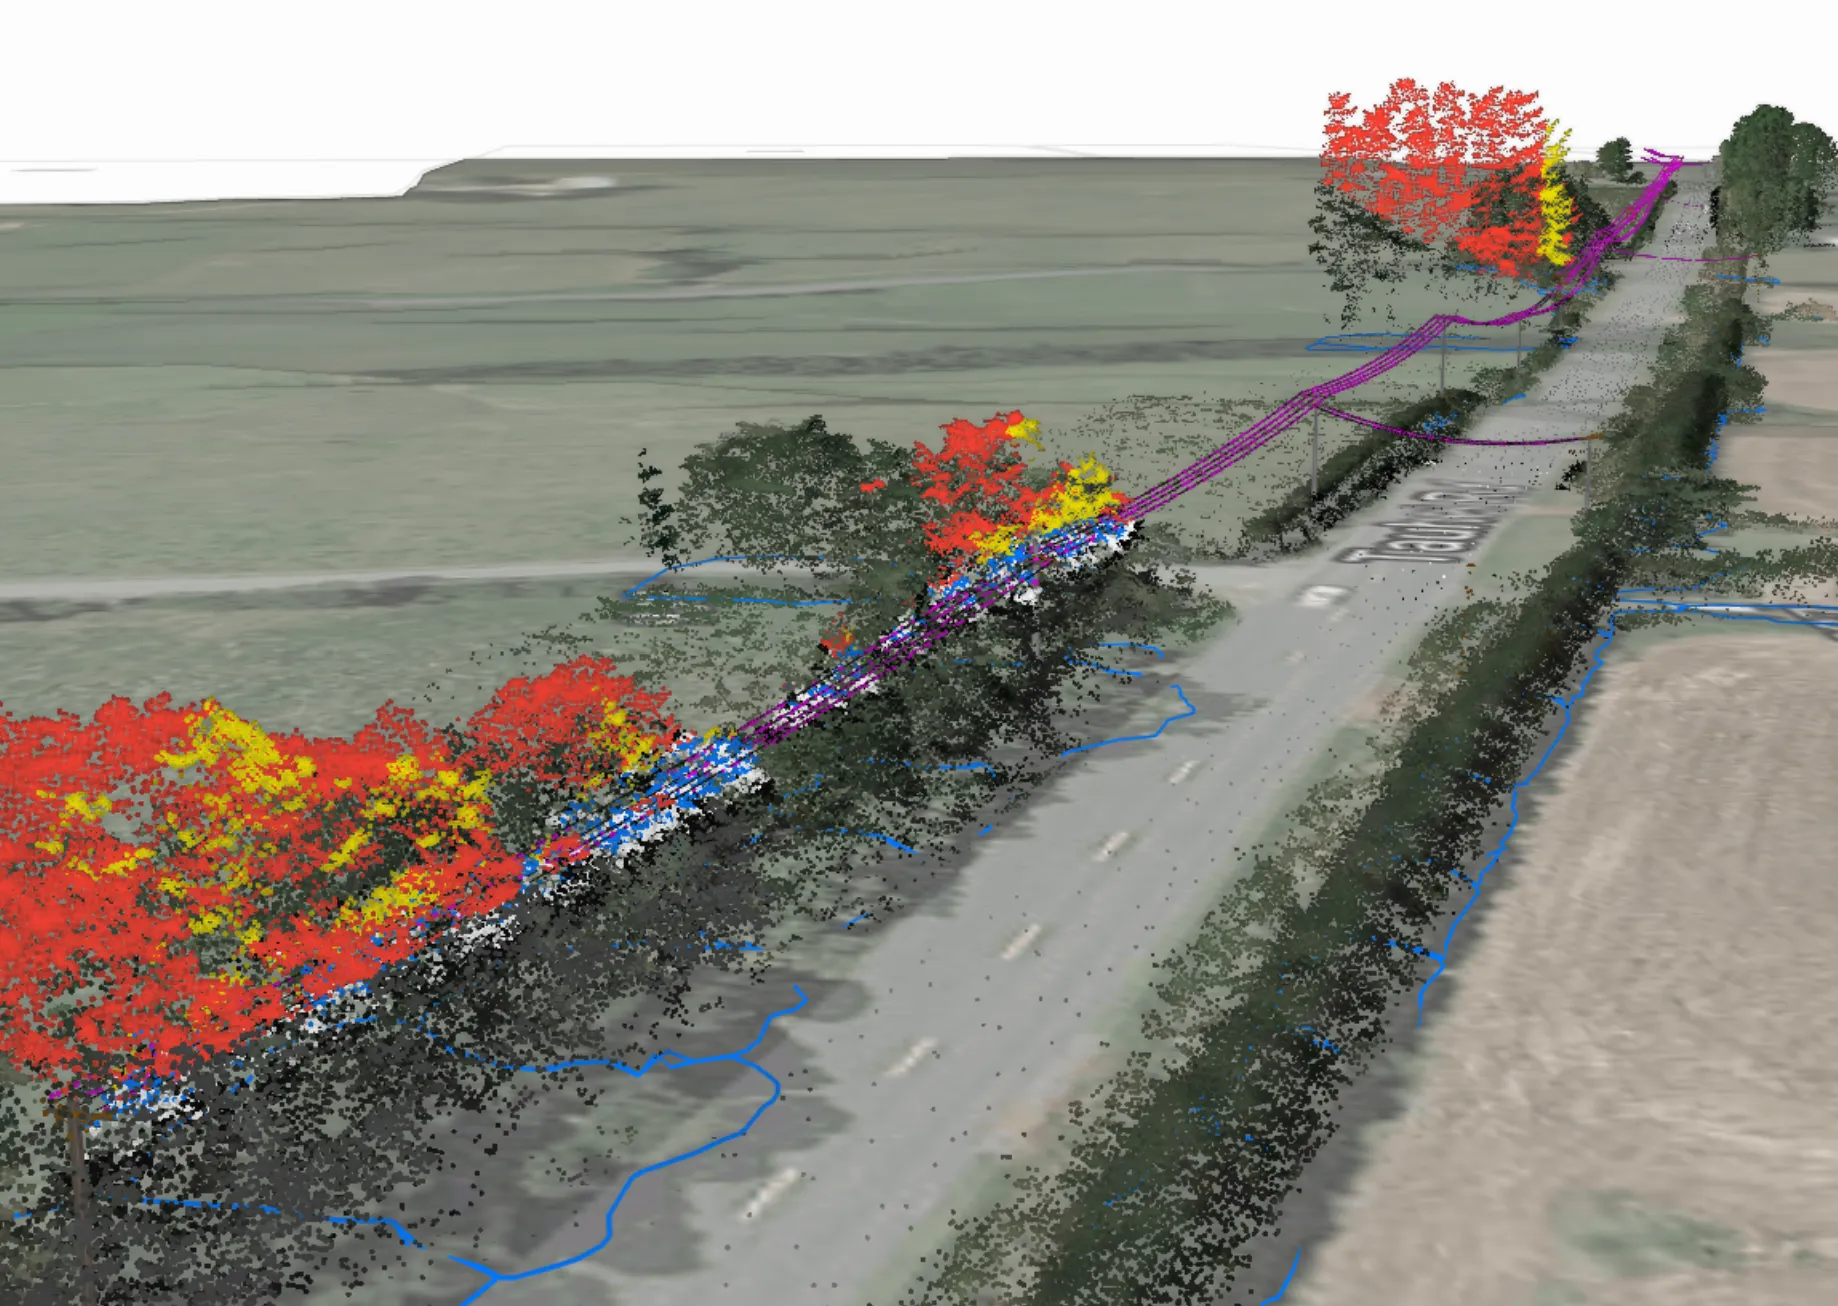
Tip-loading analysis ran across every pole in the network, pairing finite element analysis with severe weather simulation to establish which structures still held their rated load, and for how long.
The Outcome
The replacement list fell to 4,000 poles, an 84% reduction, on evidence the regulator accepted, with risk identification running 10x faster.

From statistical risk models to physics-based ones
From To
Probability inferred from past failures Failure simulated under stated conditions
Scores only the modeling team can audit Calculations anyone can open and check
A number that took a quarter to produce A number you can re-run in the meeting
Justifying spend after the decision Choosing the option before committing
Explore all workflows
See your network as one physics-enabled digital twin
Book a personalized demo and see how leading utilities rank, defend, and re-run every capital risk decision.