
Picture this: you have your storm reserve budget for the season, and the first big weather event ends up costing you 4x what you allotted for the entire season. You spend the next year or two defending every restoration dollar while working to keep customer rate increases to a minimum.
Utilities are investing at record levels, roughly $1.4 trillion in grid capital through 2030.1 That spending is driving rate-hike requests to an all-time high of $31 billion in 2025.2 Regulators now want proof of prudency on every dollar, with return on equity and customer satisfaction on the line.
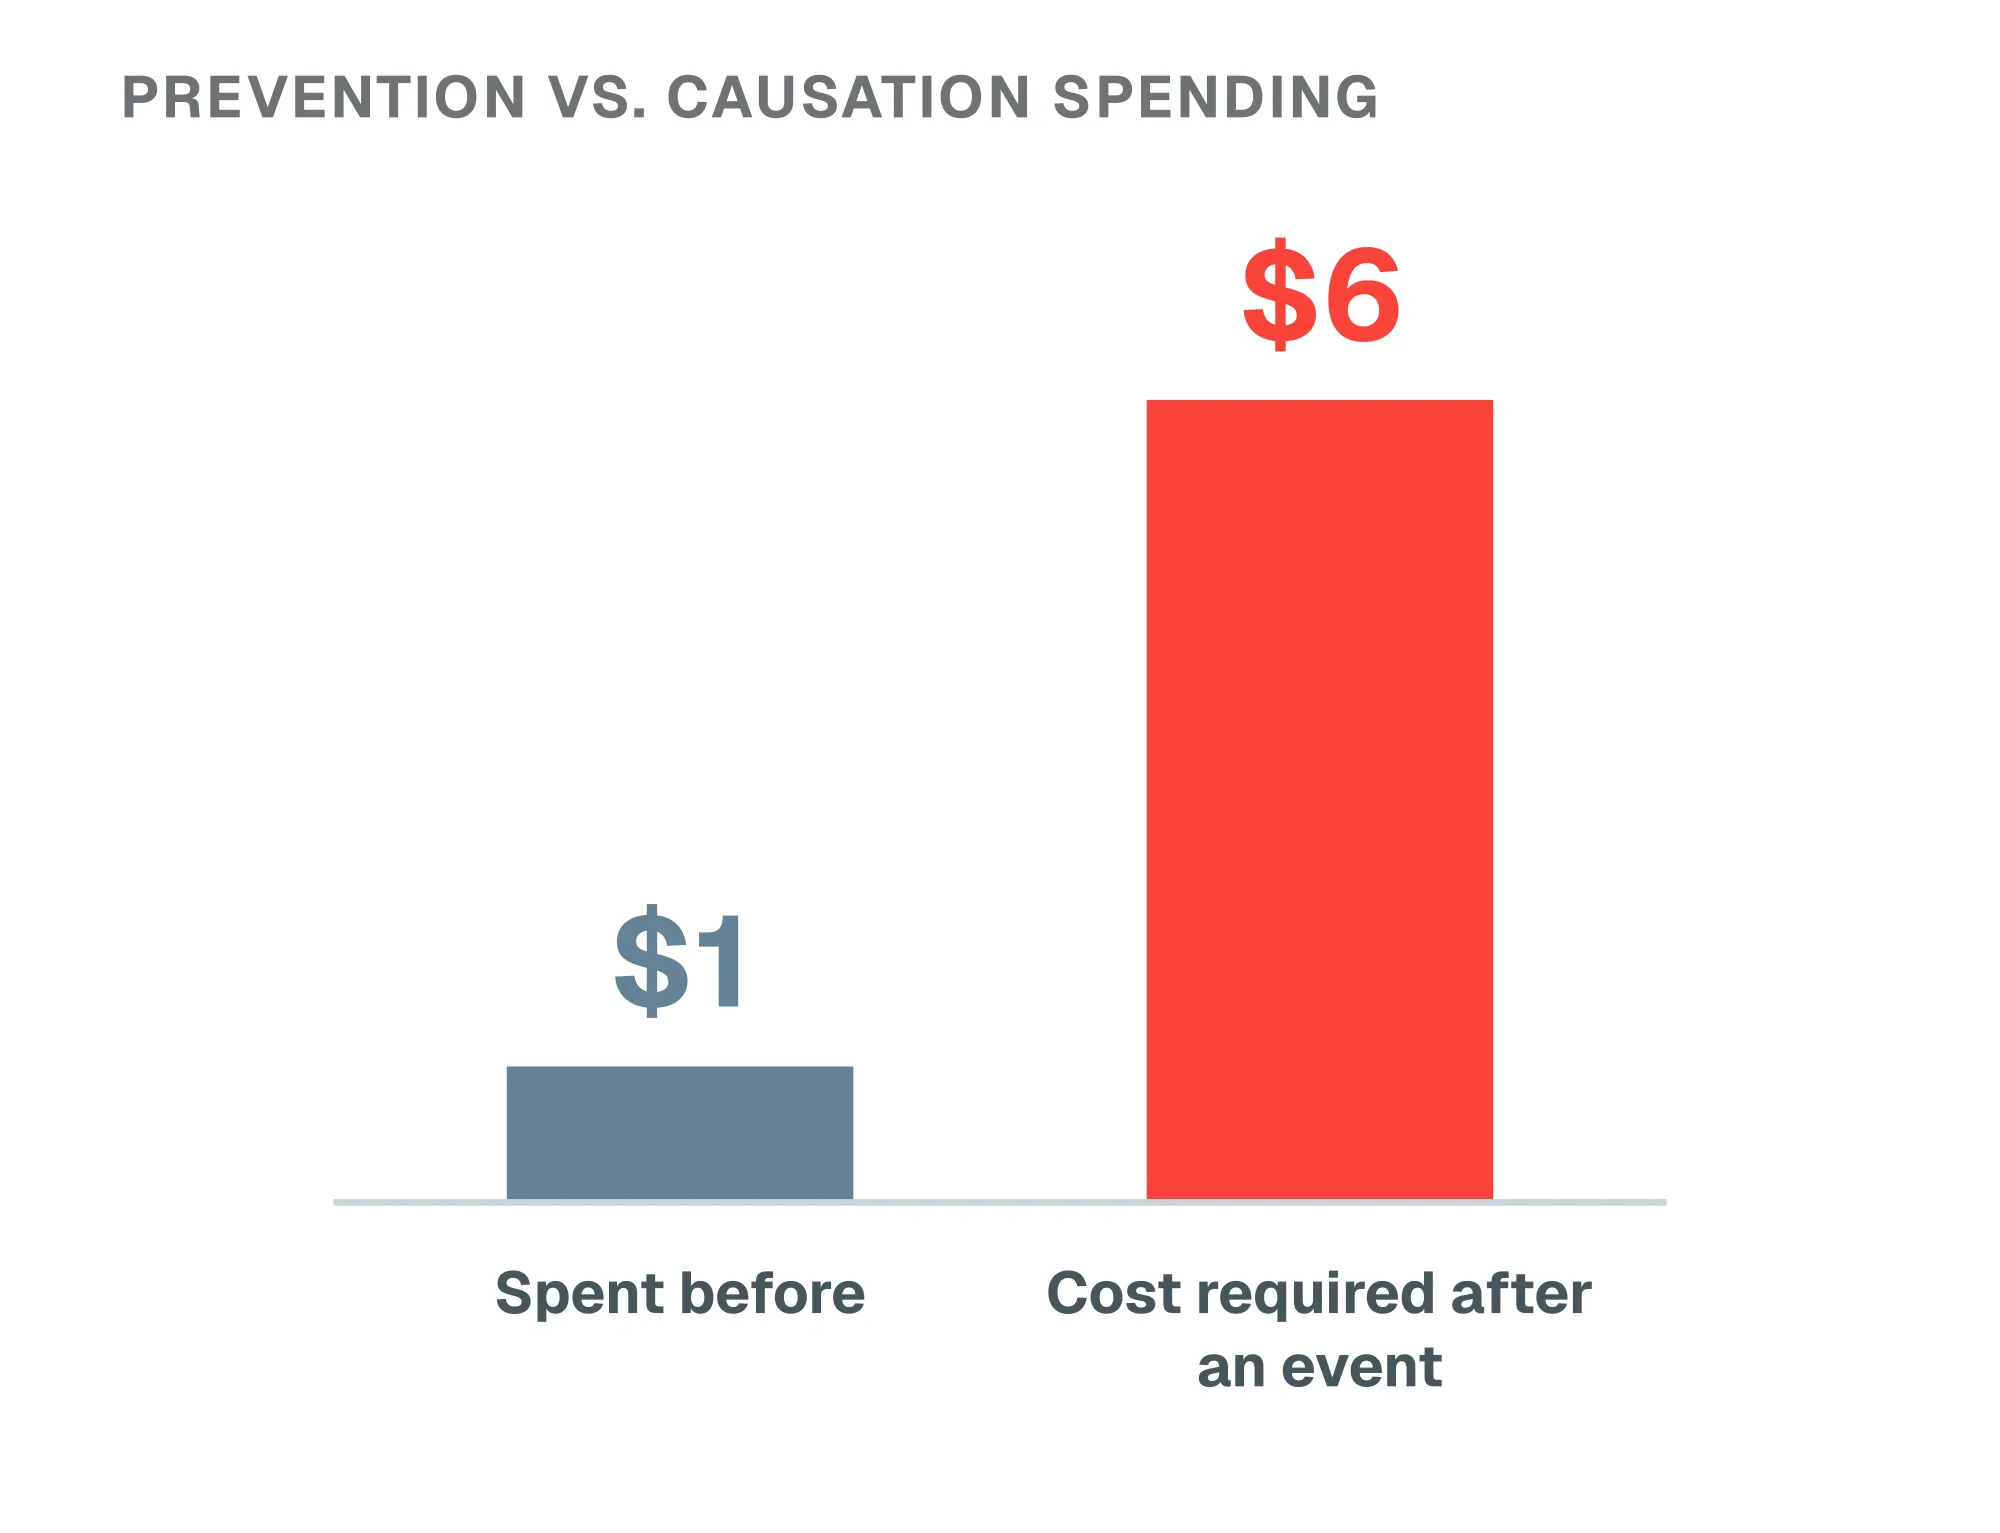
Spending after a storm is the most expensive kind: emergency crews, rushed materials, and a bill that lands on customers all at once.3 But cutting programs or spending less doesn’t solve the affordability challenge, and it can come at the cost of reliability. What does is better data: knowing where each dollar removes the most risk, committing it before an event, and defending it afterward. Spending that way costs less, can be phased in over years, and builds a network that holds up better with each round of work.
Taking on today’s biggest affordability challenges
Utilities have two key levers to improve predictability, and with it affordability: proving the impact of every dollar, which makes funding easier to secure, and aligning capital to where real risk is concentrated.
They need to be prepared to answer these questions in every planning cycle:
- Which assets are most likely to fail next, ranked by probability and consequence?
- How will a given pole or span hold up in a specific storm or load scenario, before it happens?
- What did last year’s hardening actually prevent when the storm arrived?
- Where are we over-funding assets that don’t need it, and under-funding the ones that do?
Regulators increasingly ask the same questions in resiliency plans and storm cost recovery filings.
Prove the impact of every dollar
Regulators are questioning every dollar, and spending that can’t be proven may not be recoverable. In a filing, a measured outcome beats an estimate every time.
That means knowing the condition of specific poles and feeders before and after hardening work, and how they held up in a real storm. With the whole network modeled down to each pole, hardened and unhardened feeders can be compared in the same storm. The difference in customer impact is measured, so your rate case rests on demonstrable customer benefit.
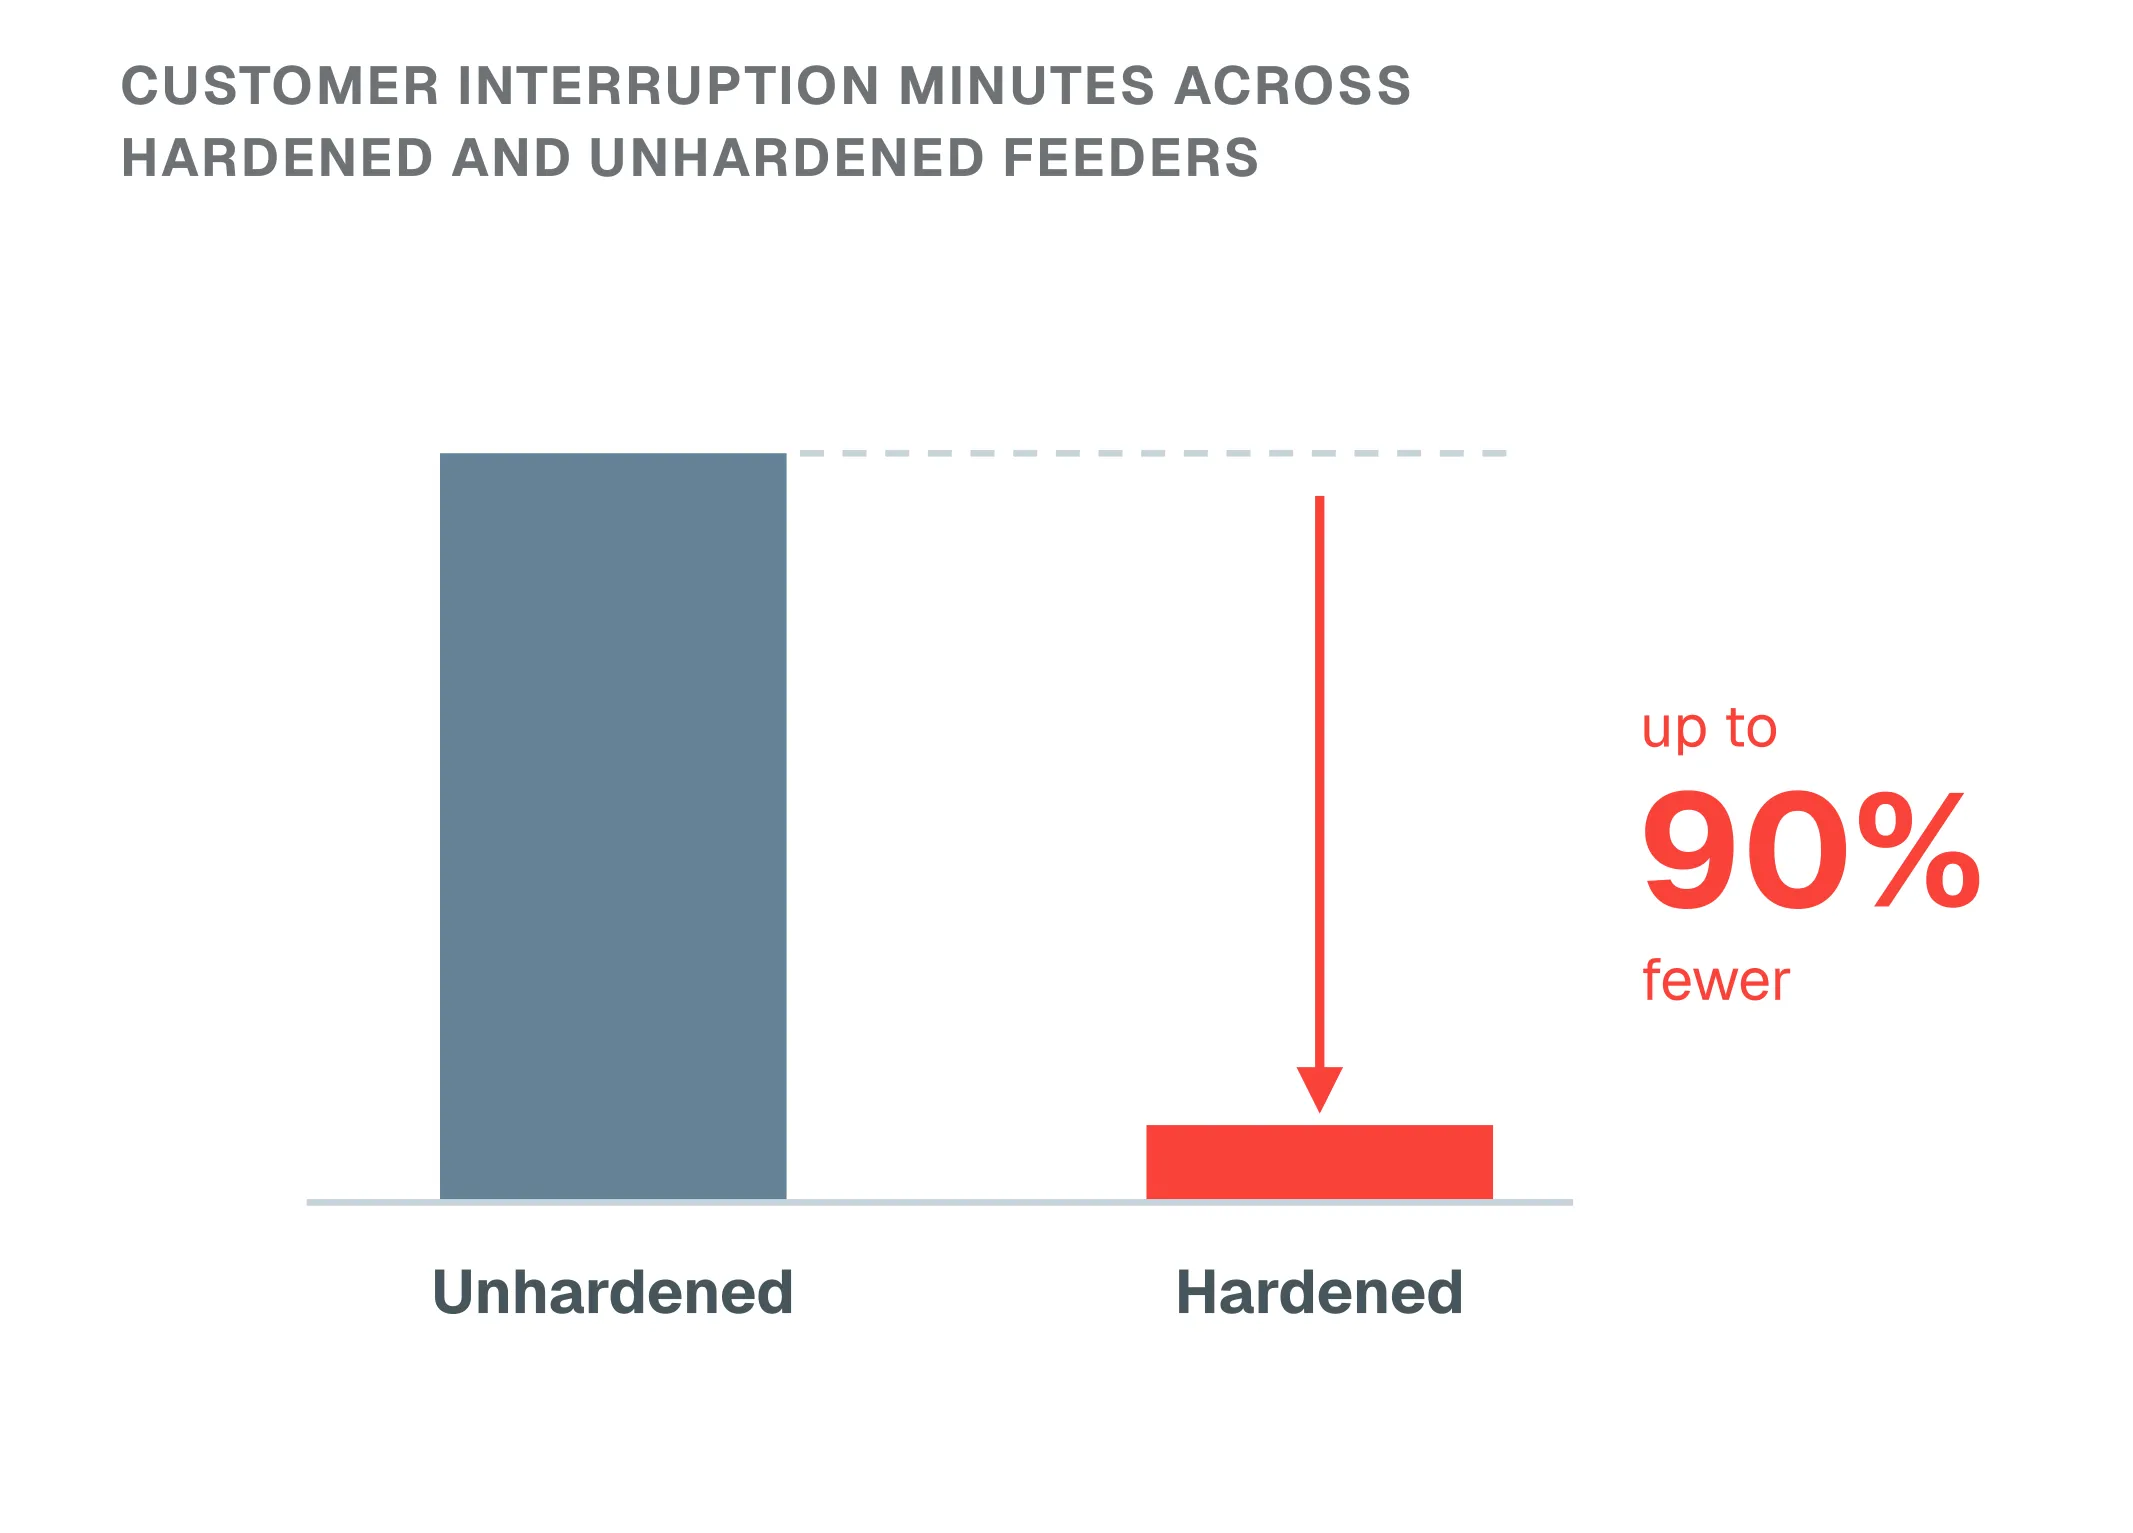
The result: in real storms, hardened assets held up several times better than unhardened ones, with customer-interruption minutes down by up to 90%. Utilities have taken that proof into regulatory filings.
Invest the right amount, in the right place
Without a network-wide view of risk, misallocation can happen in two ways. Assets that don’t need work get over-funded, which is the gold-plating regulators push back on. The assets most likely to fail get under-funded, which shows up later as an outage or a restoration bill.
Most capital plans are built from past failures: outage history, inspection findings, and asset age. That logic is easy to follow, but a pole that has never failed can still be the first one down in the next storm, so planning from history might be funding yesterday’s problems.
Neara models how each asset behaves under real conditions and ranks it by probability and consequence of failure. Every dollar goes where the risk is, and the order of work becomes the justification.
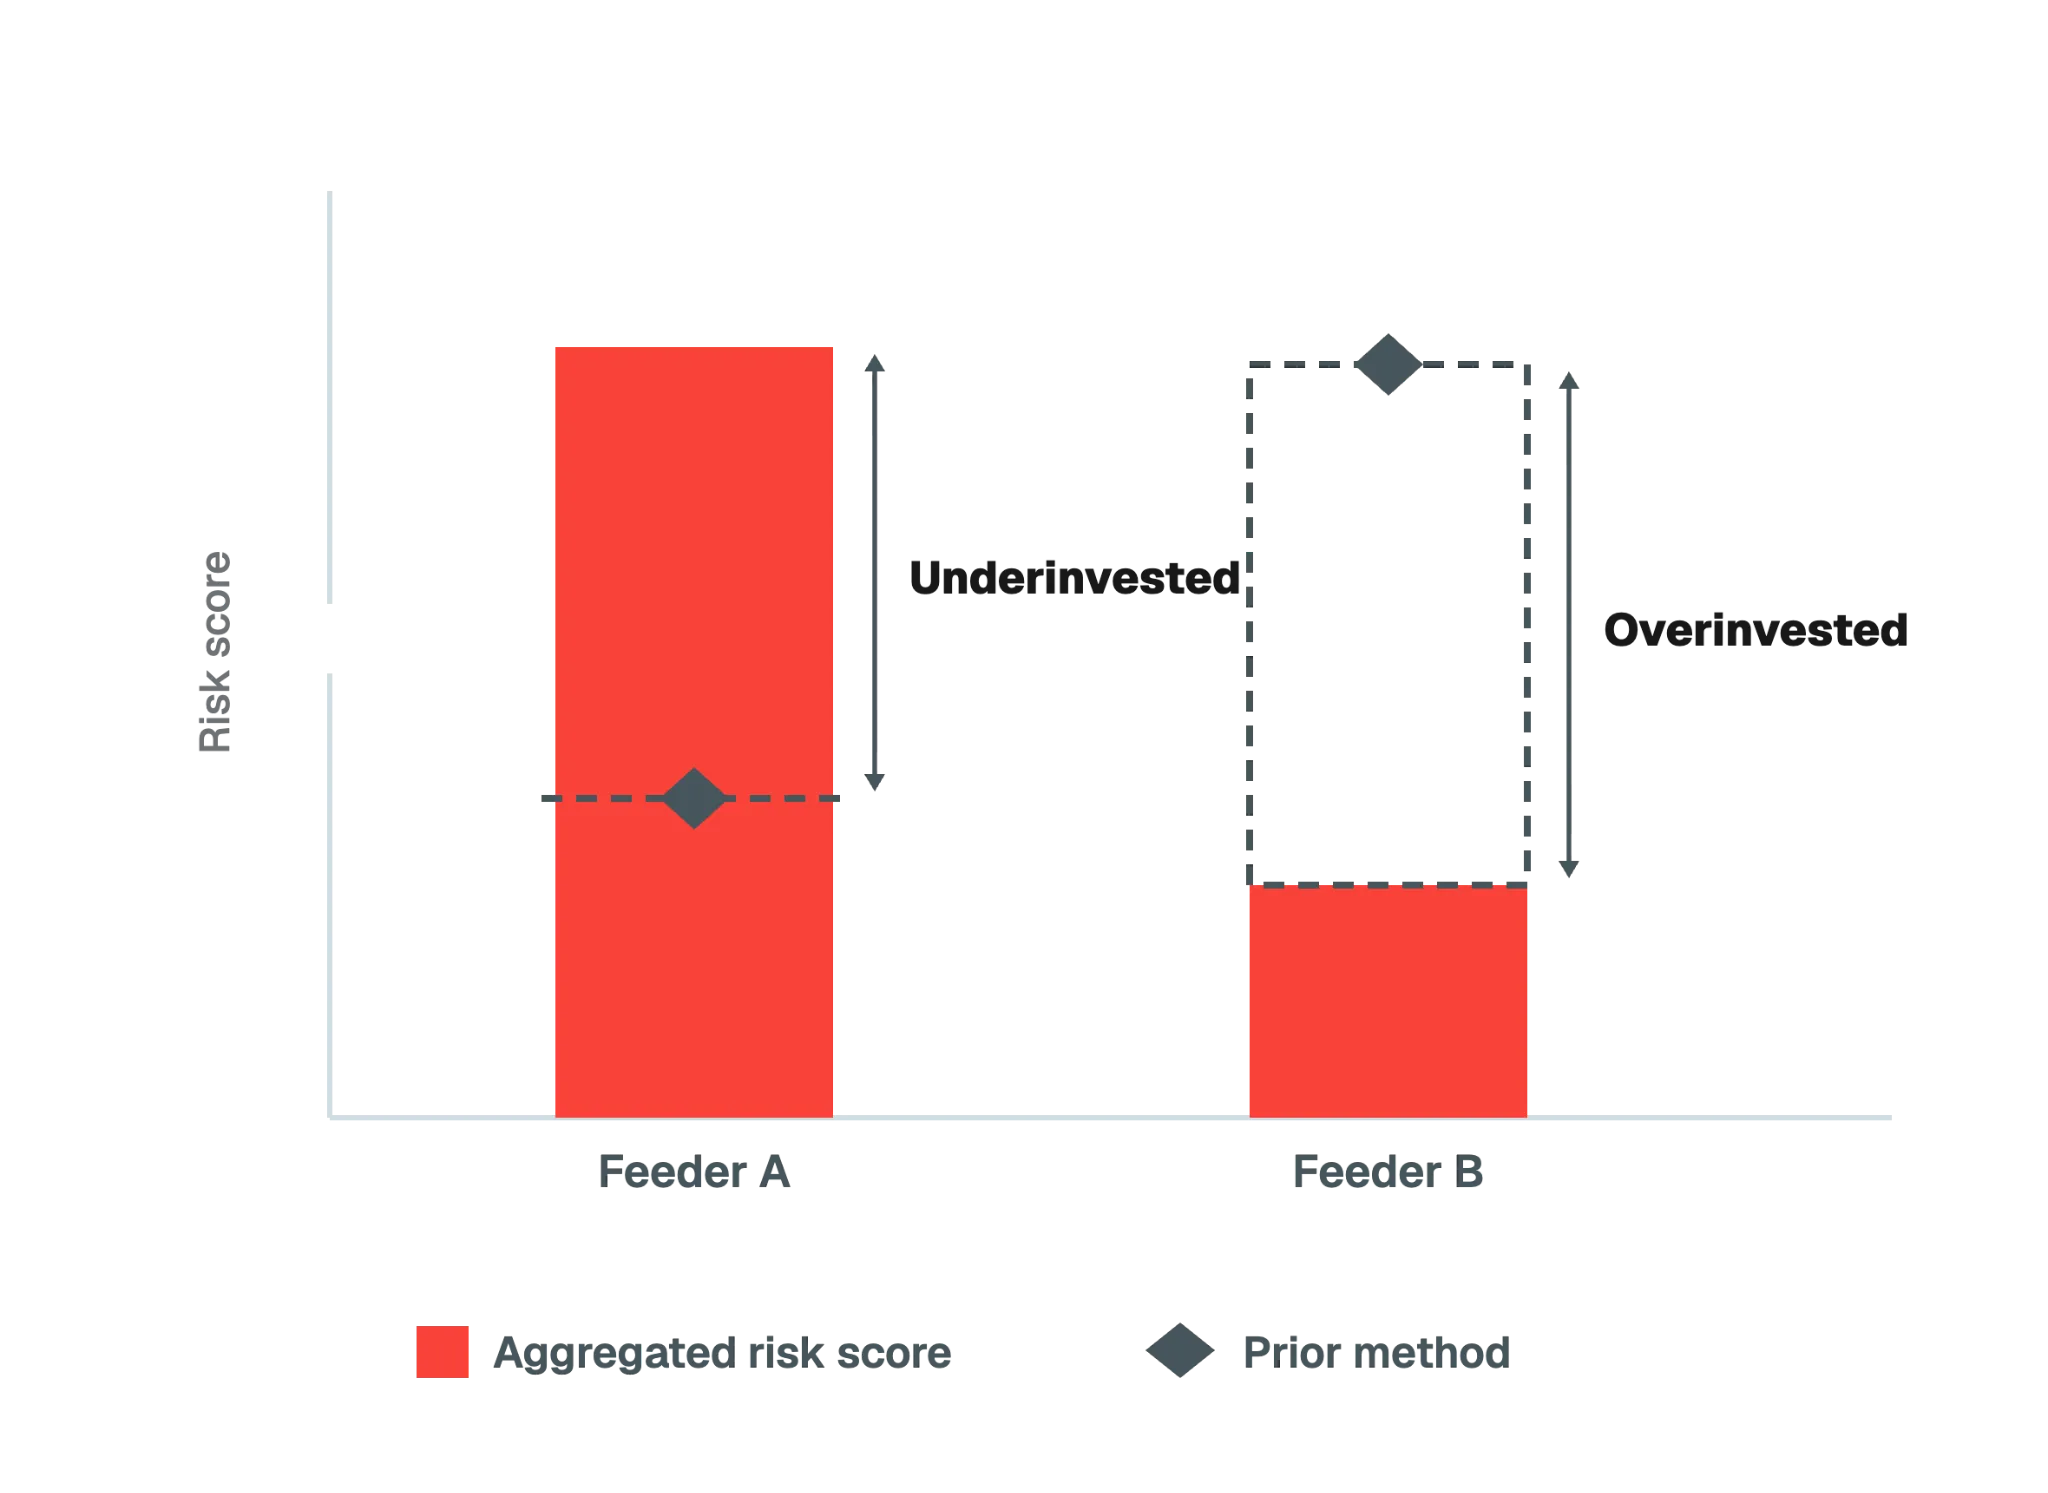
The result: up to 3x return on capital investment, with IRRs above 20%, from focusing spend on the riskiest assets.
The outcome
Both levers start from the same foundation: one structurally accurate model of the network that every team works from. Inspection findings, LiDAR, GIS attributes, outage history, and customer criticality all attach to each pole, span, and feeder, everywhere on the system. You can test interventions against weather and load scenarios before committing capital. And because every output traces back to a verifiable input, proving prudency becomes a matter of showing the work.
Affordability stops being a trade-off against reliability. You spend less, get more, and have the evidence to show a commission how.
Footnotes
-
Edison Electric Institute, 2026; Capital expenditure projections ↩
-
PowerLines, 2025; Rate-case analysis ↩
-
FEMA / National Institute of Building Sciences, 2019; Natural Hazard Mitigation Saves ↩

