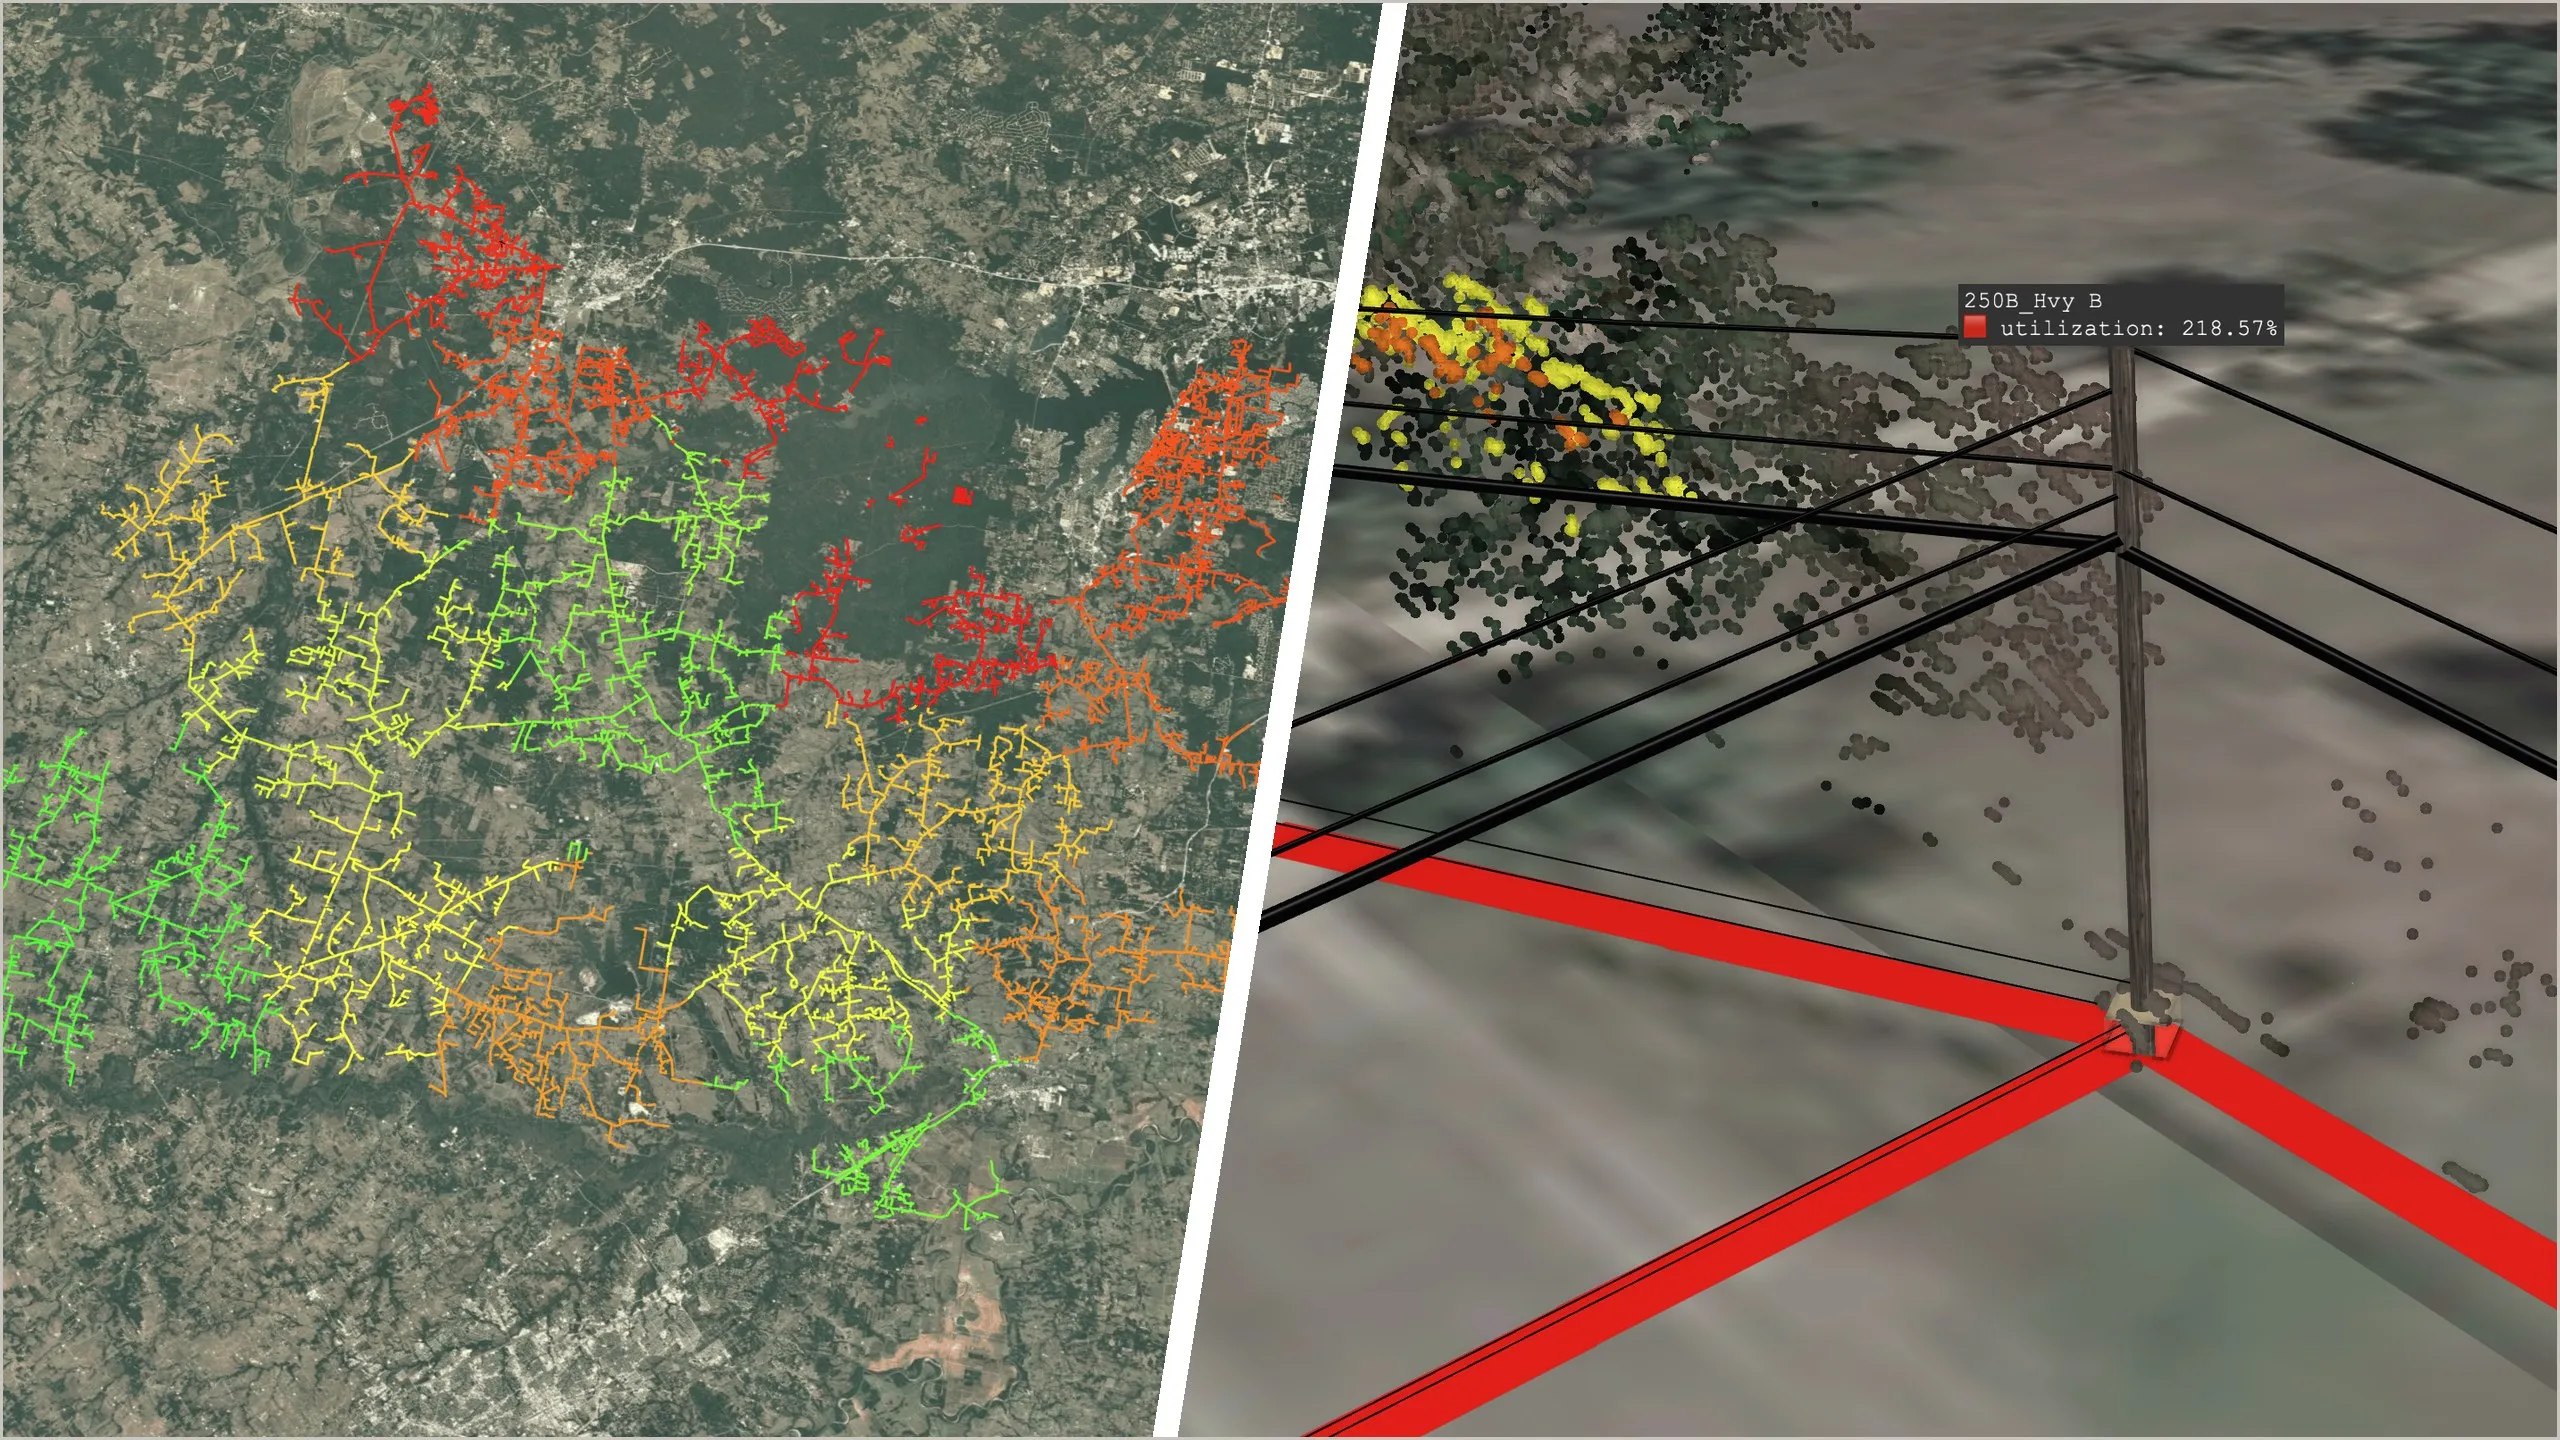
US investor-owned utilities are spending more on their networks than at any point in their history to maintain reliable service with new demand, an aging network, and more severe weather. Since 2014, distribution capital spending has increased by $27.6B, after inflation.1
Yet for the average customer, the grid isn’t getting noticeably more reliable.
Excluding major events, the average interruption duration has remained consistent at around two hours each year over the same timeframe.2 A decade of accelerated spending, and the baseline has hardly moved. Everyday reliability should be where investment results show up first, and if it’s not, that points to a problem with how utilities decide where the money goes.
This is the reliability paradox.
In our conversations with utility leaders, the same three questions come up regardless of budget size, available resources, or number of customers served:
- Are we investing in the right places?
- How do we sequence work for the greatest impact?
- How do we prove those investments are paying off?
Those questions are often harder to answer than they should be. Most utilities still prioritize reliability investments using proxies for risk: equipment age, past outage history, and regional weather exposure. Each is a necessary input to understanding a utility’s overall risk profile, but none reflects an asset’s current condition or the stressors it will face in the future. Meanwhile, teams assess risk in isolation, each with its own data and rules, making it difficult to see where risk is most concentrated across the network. Answering these questions requires a shift from making investment decisions based on proxies to decisions driven by aggregate risk, so each dollar maximizes the reliability benefit for its cost.
This shift starts with a single view of risk. A shared, physics-based risk model provides it, connecting what has happened in the past with the magnitude of risk across the network today and how that risk is likely to change over time. Investment decisions are driven by where risk is heading, not by the most visible problem or what failed last, and every team works from the same source to prioritize the portfolio as a whole.
Why the paradox persists
Part of what’s driving the reliability paradox is outside any utility’s control. Equipment and construction costs have risen alongside spending, so each dollar buys less than it did before. Severe storms are more frequent, heightening design standards. And infrastructure continues to age, pushing more assets beyond their intended lifespan.
These pressures raise the stakes for every investment decision. When each dollar buys less and an aging network has to withstand harsher conditions, where each dollar is spent matters more than ever.
For decades, historical proxies were a reasonable guide for deciding where to invest in reliability, but that’s no longer the case. The grid and its surrounding environment are changing constantly, and stress continues to compound, creating new points of failure that history alone can’t anticipate. Past performance data and statistics also aren’t enough to explain why one pole, span, or feeder was chosen over another, why now, why this solution instead of an alternative, or how much risk it will remove.
That level of investment justification is increasingly becoming the regulatory standard utilities are held to. Under California’s current Risk-Based Decision-Making Framework, utilities must include benefit-cost ratios in their risk assessment and general rate case filings and evaluate risk by both the likelihood and consequence of failure.3 They must also clearly document the calculations behind their risk estimates, including how engineering judgment was applied.
Timing matters
Deciding where to invest is only part of the challenge. The order of work matters as much as the work itself. Most capital plans span several years, so you could complete the same projects, with the same budget, over the same timeframe and still see different results depending on where you start.
That’s because risk is rarely spread evenly across your network. A relatively small number of assets, spans, and feeders can carry a disproportionate share of your total risk. When work is sequenced by schedule, geography, or program cycle, high-risk areas are addressed on the plan’s timeline rather than in order of risk, prolonging customer exposure.
Take a five-year plan to address two hundred feeders. If the work is prioritized without regard to risk, roughly a fifth of the plan’s risk reduction happens in year one. If the same feeders are ranked by risk, and the highest-risk are addressed first, year one removes a far larger share of risk. The total spend and the final work completed may be the same at year five, but the risk customers carry while the work is underway is significantly lower.
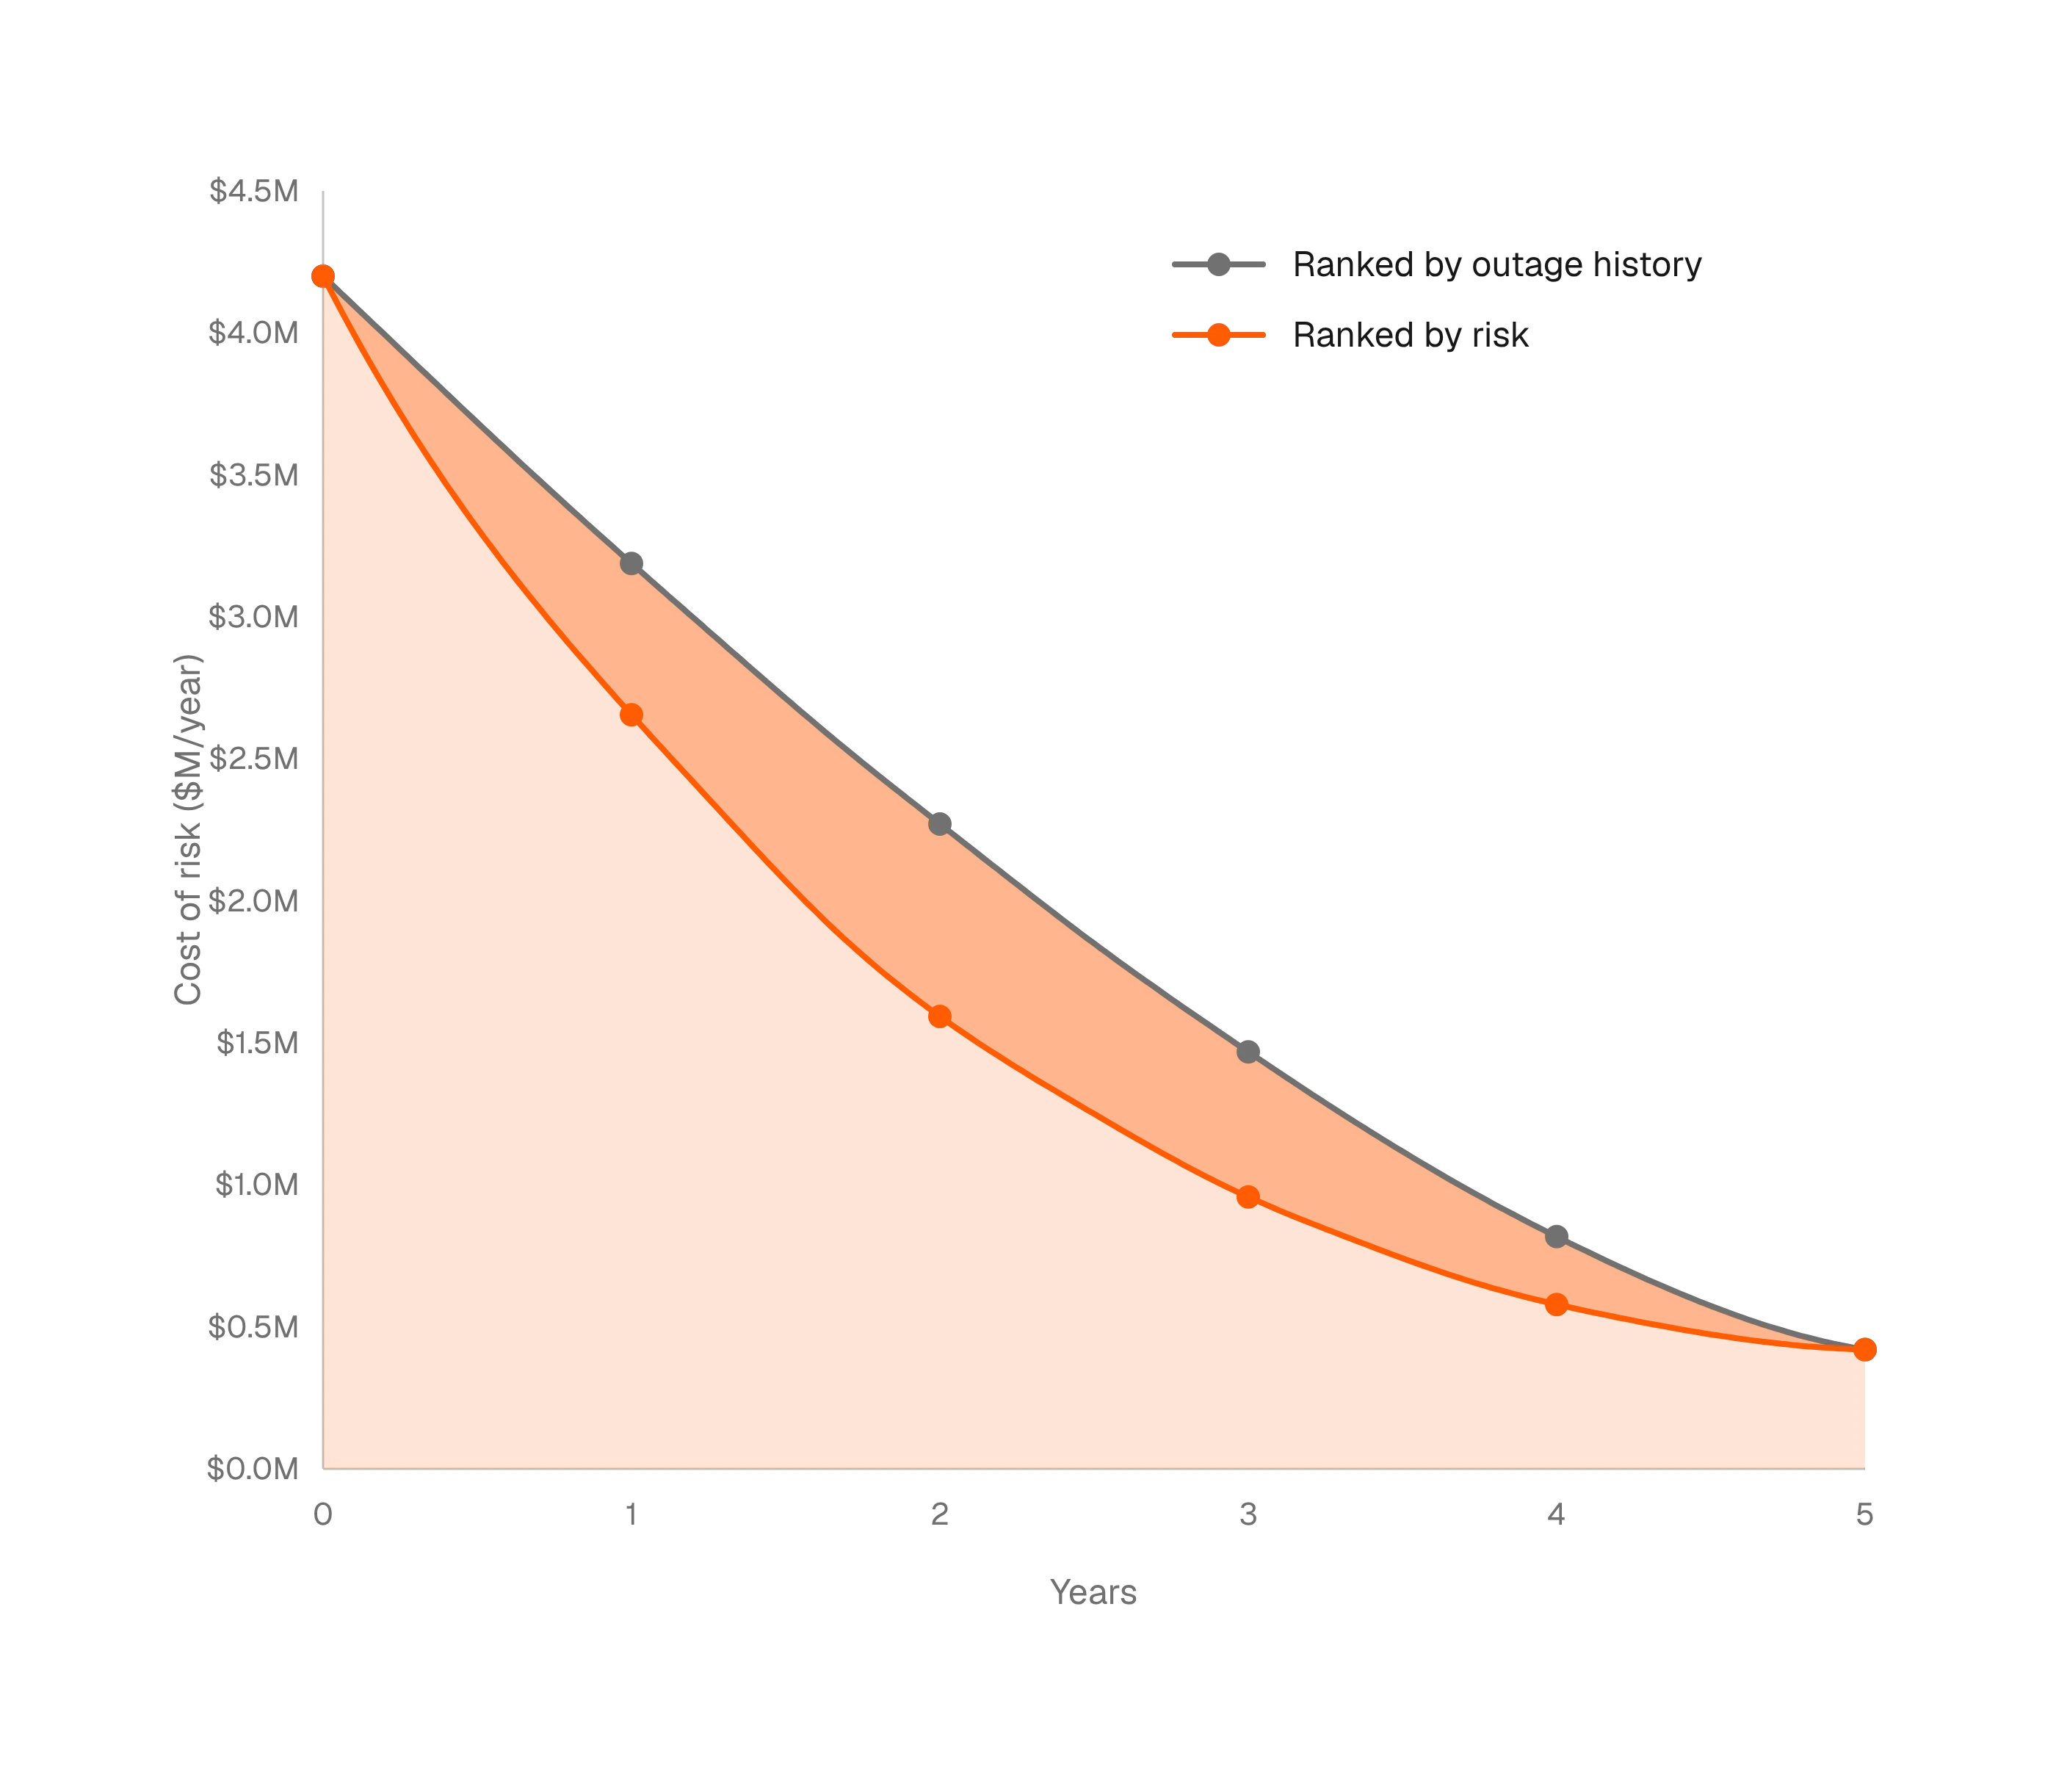
That is the difference between spending on reliability and buying down risk.
Redefining how you measure risk
A physics-based risk model runs on your real network geometry, combining LiDAR, GIS, asset and inspection records, to identify the current condition of each pole, span, and conductor. This enables you to simulate how assets would respond to environmental forces like wind, heat, or ice, so you can evaluate risk across three dimensions:
- Likelihood: What is the likelihood that an asset, span, or feeder will fail when accounting for structural and vegetation risks including pole lean, vegetation grow-in, remaining strength, and clearance?
- Consequence: What would the consequence of that failure be in terms of customers impacted, restoration complexity, and proximity to critical infrastructure?
- Weather Exposure: How does that risk change on a blue sky day compared to a major event day?
The model combines and weights these dimensions into a normalized risk score for each asset, which can be viewed at any level, from a single pole to the entire system. That score gives you a consistent basis for comparing and ranking risk across the network, directing investment where it removes the most risk per dollar spent. Since every calculation and output shares a common denominator, you have the evidence to justify each investment decision to regulators, boards, and customers.
Proving the impact
Risk reduction only matters if you can show it’s working. Because a physics-based risk model captures likelihood, consequence, and weather exposure for every asset, you can also use it in reverse. Backcasting runs past conditions like a major storm or a severe heat event against the network as it exists today, showing how the same event would play out now that the work is complete. You can see which investments reduced risk, where outages would likely have been avoided, and where risk remains. Instead of waiting years for outage data to reveal whether a program improved reliability, you can measure its impact as soon as the work is done.
As frameworks like California’s show, utilities are being asked to back investment decisions with documented, data-driven calculations: how much risk each investment was expected to remove, at what cost, and whether it delivered. The shared risk model makes that possible, because the same calculations used to justify the investment can demonstrate its results.
It also matters for future funding requests. Utilities requested a record $9.2 billion in rate increases in the second quarter of 2026.4 As bills climb, customers and regulators will want to see that their money is buying better reliability. That proof will determine which future funding requests are approved. Utilities that can show each dollar’s impact on risk will be far better positioned to secure the next round of investment.
The path forward
The reliability paradox persists because the way utilities decide where to invest hasn’t kept pace with how much they invest.
The three questions utility leaders ask are not separate challenges. All three rest on a system-wide understanding of risk. A shared, physics-based risk model enables you to direct investment where network risk is greatest, sequence work to remove the most risk as early as possible, and show the impact of each decision.
Utilities that make this shift can close the gap between record spending and reliability performance.
Sources
- Lawrence Berkeley National Laboratory, 2026; Electric Utility Distribution Costs: Scoping Study on Trends, Drivers, and Possible Response Strategies
- U.S. Energy Information Administration, 2024; Electric Power Annual Report
- California Public Utilities Commission, 2025; Risk-Based Decision-Making Framework (RDF): R. 20-07-013
- PowerLines, 2026; Utilities Request $18.6 Billion in Rate Increases in First Half of 2026

