Neara’s work with CenterPoint Energy featured on KPRC-NBC Houston!

Watch the segment

Stop reacting to
high winds heavy rain excessive heat cold snaps load growth outage risks

Predictive modeling software for proactive network governance. Quantify and prove network needs in any scenario. Run precise analyses in hours and days instead of months or years in the field.

Trusted by global utilities to keep networks safe and online in hurricanes, heat waves, hail storms, and more.

Outages and safety incidents are no surprise when you can only see a small fraction of your network at a time — and only see your assets and vegetation on their best behavior.

You’re trying to prioritize equipment maintenance, trim jobs, and capital projects — but you can only prioritize solutions to risks you can see.

You need to understand exactly how your assets will respond to severe weather — but field surveys only happen on fair weather days.

You need to prove your plan will actually solve reliability and resilience challenges — but measuring outcomes looks like guesswork.

Network governance is 80% reactive and 20% proactive. For utilities using Neara, it’s the other way around.

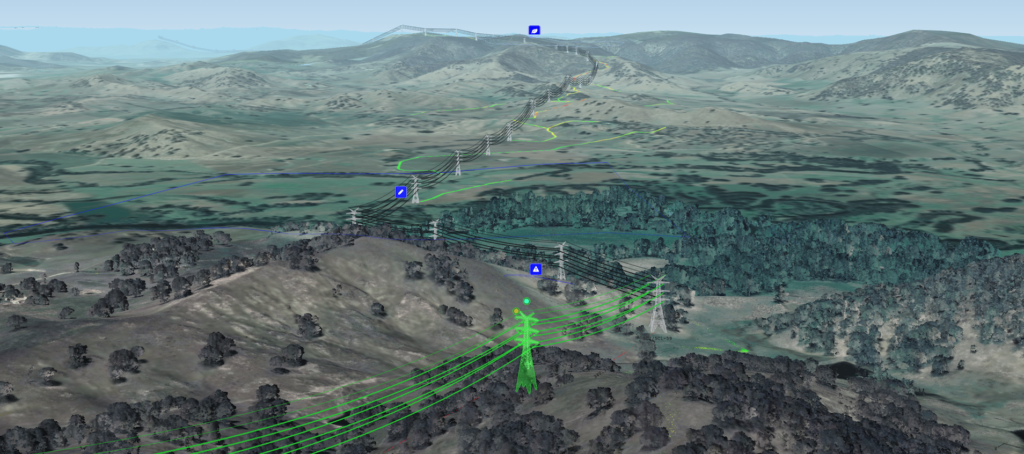
1. Generate behaviorally identical digital model of your entire network.

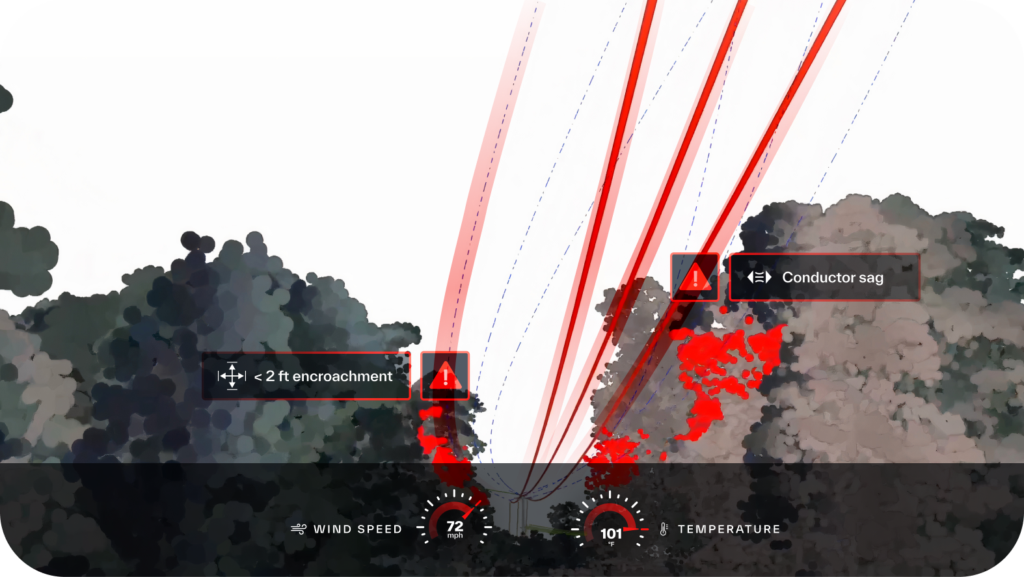
Every asset bends, deforms, and sways in response to >100mph winds, flash floods, and more exactly as it does in field. Correct GIS errors and set the record straight on every asset location, configuration, and clearance measurement.
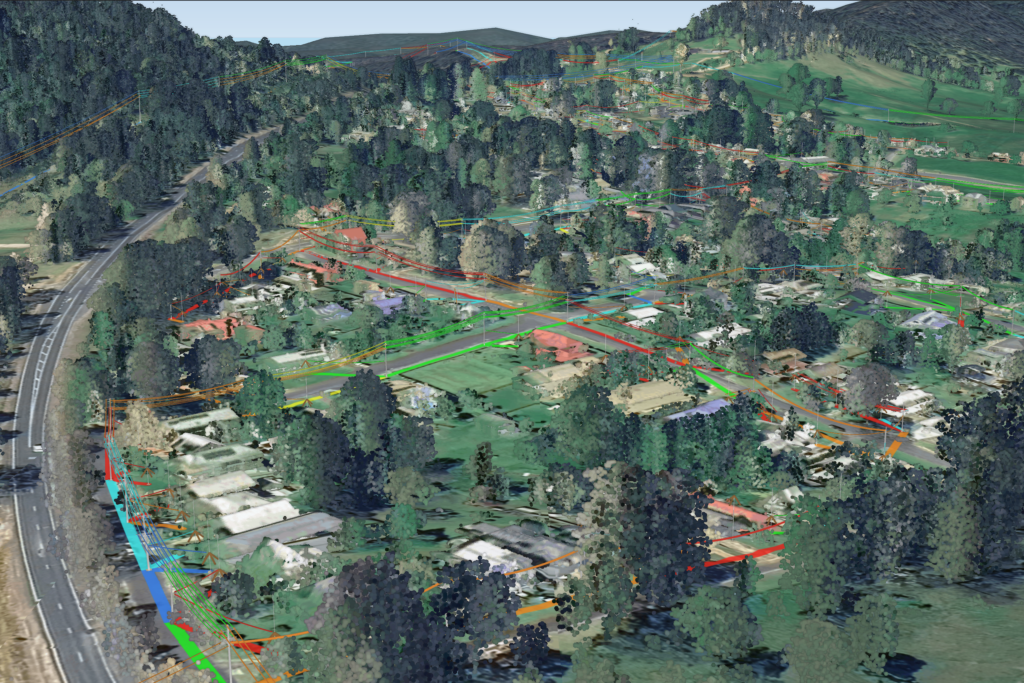
2. Execute network-wide simulation analyses so you know exactly what to expect in the field.

Simulate scenarios like severe weather and new network design to pinpoint key vulnerabilities and test-drive potential remediation solutions before spending a dollar or breaking ground in the field.

3. Run reports that quantify network needs and measure outcomes.

Need to validate your vegetation budget number? Demonstrate which poles actually need replacement? Justify your new transmission line? Objectively define network needs with demonstrable data regulators and other key stakeholders will understand.

How To Fix The Greatest Threat to Reliability and Resilience

A Primer on Digital Risk Mitigation

See How

Answer any question with Neara

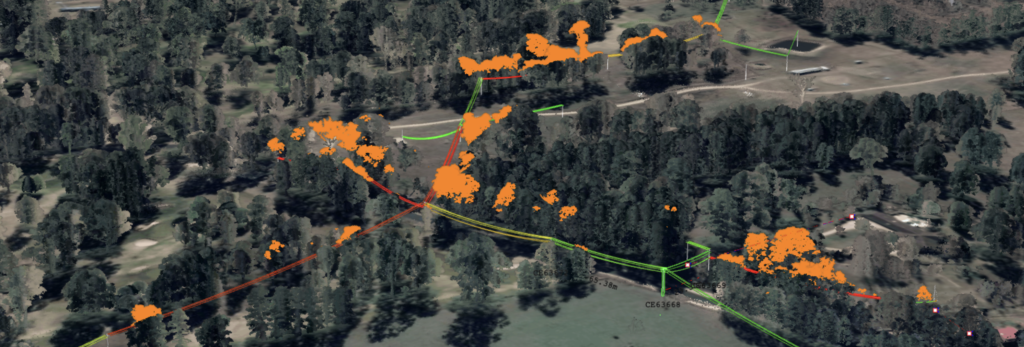
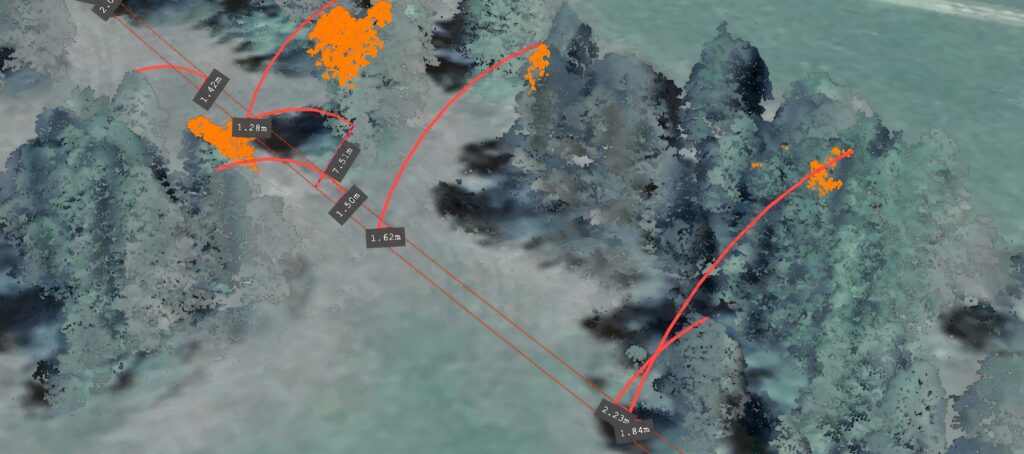
If SE wind speeds exceed 70mph, which trees will be fall-in risks?

Complete vegetation work

50%

faster

CASE STUDY

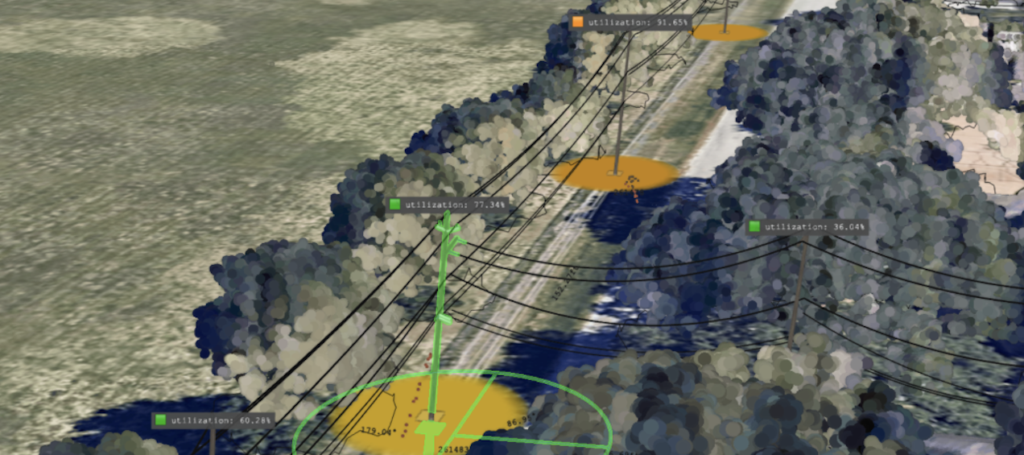
Which pole failures will cause the most outages in a storm?

Restore
power

3x

faster

CASE STUDY

Where will floodwaters recede fastest?

Remove

300

hours of manual inspection time

CASE STUDY

Where exactly would steel poles work best?

Defer

3k

pole replacements

CASE STUDY

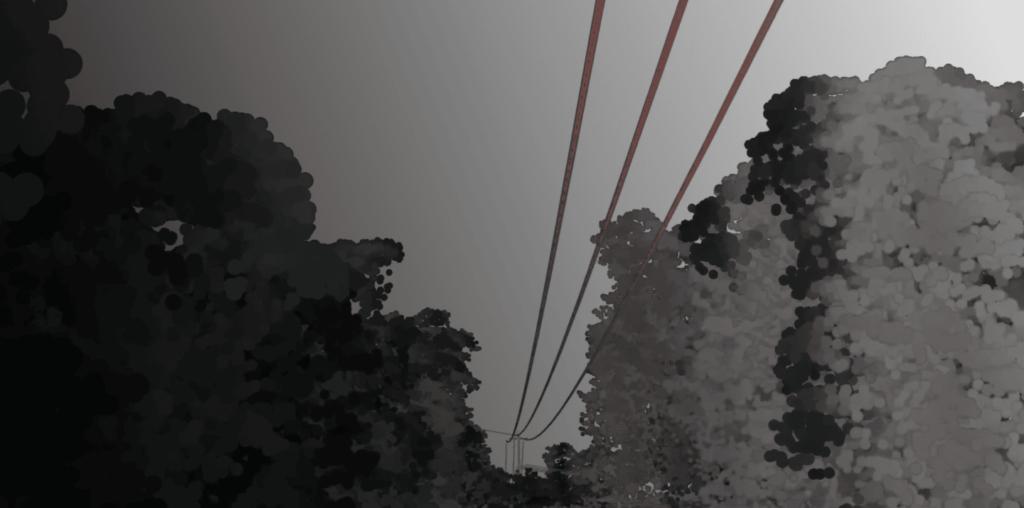
Where are conductor clash risks close to major highways?

Identify clash risk

10x

faster

CASE STUDY

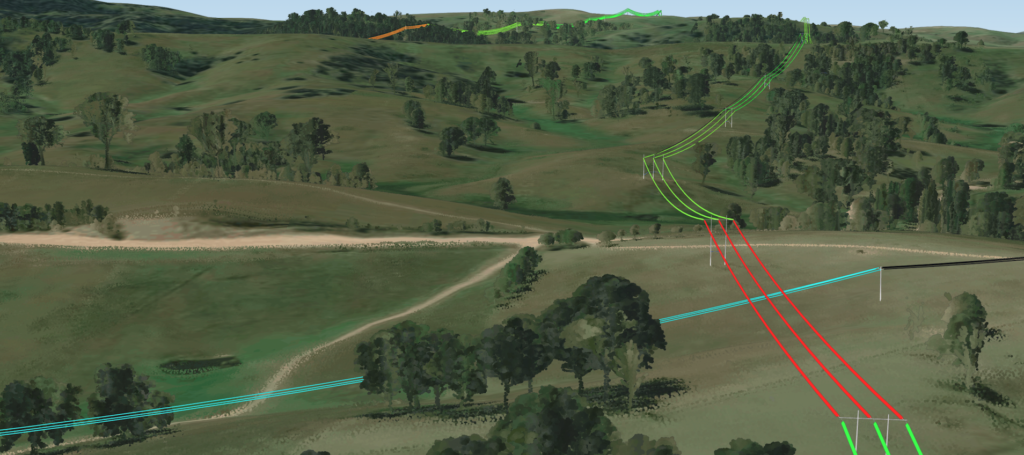
What’s the optimal span length for a new line over hilly terrain?

Design new network

85%

faster

CASE STUDY

Which assets are missing from my GIS?

Correct

000’s

of GIS discrepancies

CASE STUDY

Explore Solutions

9x

Identify and resolve
outage risks 9x faster

Network Health & Reliability

3x

Identify asset failure risks
3x faster vs. other software

Digital Asset Management

85%

Implement network
design changes 85% faster

Network Design

3x

Restore power
3x faster

Weather Resilience & Grid Hardening

2x

Without building new infrastructure
2x existing network capacity

Renewable Energy & Decarbonization

‘000s

Correct ‘000s
of GIS discrepancies

Digitization

Power your network to a whole new level

  • Conduct cost-benefit analyses in minutes, not months
  • Eliminate thousands of field visits
  • Save millions of dollars annually
Talk to us to about how

Success stories

While piloting Neara, we were able to simulate the impact of major flooding in late March. Rather than wait for digital inspections we eliminated 300 hours of inspection time and targeted our response to customers that needed assistance most.

CASE STUDY

By monitoring water and clearance levels daily, SA Power Networks was able to leave power on for longer for many customers as the floodwaters rose and also restore power more quickly as water receded. This innovative approach allowed for the re-energisation of power lines within five days, compared with the originally anticipated three-week timeframe using traditional manual methods.

CASE STUDY

We have found that the temperature our lines can operate at is much higher than we previously understood. Historically, we have had to apply a crude standard across the network. By modeling each span individually, we found that in many parts, the capacity is twice as high as we previously thought.

CASE STUDY

Which assets need your attention?

Learn how to find out, fast.

Get a demo
Close